
Tyrannosaurus rex, Osborn, 1905
|
publication ID |
https://doi.org/10.1038/nature02699 |
|
DOI |
https://doi.org/10.5281/zenodo.3811869 |
|
persistent identifier |
https://treatment.plazi.org/id/038987C6-350E-FFB6-FCDE-D91CFE419F37 |
|
treatment provided by |
Jeremy |
|
scientific name |
Tyrannosaurus rex |
| status |
|
Stemming from more than a century of investigation, considerable understanding of tyrannosaurid osteology 4, myology 5, neurology 6, behaviour 7, 8, physiology 3, 9, physical capabilities 10, 11 and phylogeny 12, 13 have been gained. Lacking are empirical data on tyrannosaurid life history such as growth rates, longevity and somatic maturity (adult size) from which the developmental possibilities for how T. rex attained gigantism can be formally tested.
Recent advances in techniques for determining the ages at death of dinosaurs by using skeletal growth line counts 3, 14, coupled with developmental size estimates 3, make quantitative growth-curve reconstructions for dinosaurs feasible. These methods have been used to study growth rates in two small theropods, a small and a large ornithischian and a medium-sized and a gigantic sauropodomorph 3. These data were used to derive a regression of body mass against growth rate and to generalize broadly about non-avian dinosaur growth 3. However, because of the phylogenetically disparate nature of these data (that is, none are close outgroups to one another) it has not been possible to use them to infer how specific cases of size change occurred within dinosaurian sub-clades such as the Tyrannosauridae . Such an understanding requires multi-species sampling at low taxonomic levels (that is, among closely related species) and access to growth series spanning juvenile through adult stages, a rarity among extinct dinosaurs 15. Furthermore, it requires the capacity to account for growth line losses due to medullar cavity hollowing and cortical remodelling 16, two processes that are pervasive in the major weight-bearing bones from large theropods such as tyrannosaurids.
The sampling problem has been overcome in North American tyrannosaurids. A flurry of recent discoveries has greatly increased the number of substantially complete specimens representing various growth stages available for study. For example, more than 30 T. rex specimens are known 4, 17, compared with only 11 reported in 1993 (ref. 18; see Supplementary Information). Recent work has broadened the developmental representation of these animals by showing that several purported ‘dwarf’ tyrannosaur species are juveniles of larger, previously recognized forms such as T. rex 12, 13, 19, 20. Finally, preliminary analyses for this research revealed that several non-weight-bearing bones in tyrannosaurids (for example pubes, fibulae, ribs, gastralia and postorbitals) did not develop hollow medullar cavities and showed negligible intracortical remodelling during their entire life history ( Fig. 1 View Figure 1 ). Like major long bones, these elements are effective for assessing longevity in living reptiles ( Fig. 1 View Figure 1 ) 21, 22 and hence provide a viable alternative method for determining the age at death of extinct reptiles such as tyrannosaurids.
Here we exploit these findings to determine the pattern of growth in T. rex and three of its close tyrannosaurid relatives. We then use character optimization methods 23 to infer how T. rex attained giant proportions among tyrannosaurids. Finally, this new evidence is used to further our understanding of tyrannosaurid biology. In performing these analyses, we sampled several amedullar bones from adolescent, juvenile, sub-adult and adult representatives of the North American Late Cretaceous tyrannosaurids Albertosaurus sarcophagus , Gorgosaurus libratus , Daspletosaurus torosus and T. rex . Longevity in each of the 20 specimens was assessed from line counts in histological sections by using polarizing, dissecting and reflected-light microscopy ( Fig. 1 View Figure 1 ) 3, 14. Conservative estimates of body mass (see Supplementary Information) were made by using femoral circumference measures 24. Longevity and size data were plotted and least-squares regression was used to determine the first empirical growth curves for tyrannosaurids 3. The length and timing of the various developmental stages and the maximal growth rates for each taxon were compared 25. The results were examined in an evolutionary context 23 by using two competing phylogenetic hypotheses for the Tyrannosauridae 12, 13.
Sampled longevities for T. rex ranged from 2 to 28 years and corresponding body mass estimates ranged from 29.9 to 5,654 kg ( Table 1 View Table 1 ). The transition to somatic maturity in this taxon seems to have begun at about 18.5 years of age ( Fig. 2 View Figure 2 ). At least one individual (exemplified by FMNH (The Field Museum) PR 2081 ), showed evidence for prolonged senescence in the form of conspicuously narrow pericortical growth-line spacing ( Fig. 1 View Figure 1 ). Maximal growth rates in T. rex were 2.07 kg d ‾ 1 and such exponential rates were maintained for about 4 years ( Fig. 2 View Figure 2 ). The longevity estimates for T. rex outgroups ranged from 2 to 24 years and corresponding body sizes spanned from 50.3 to 1,791 kg ( Table 1 View Table 1 ). Somatic maturity occurred at between 14 and 16 years in these taxa ( Fig. 2 View Figure 2 ). Like T. rex , at least some exceptionally large individuals of A. sarcophagus and D. torosus showed narrow pericortical growth-line spacing indicative of the onset of senescence. The maximal growth rates for the three smaller tyrannosaurid taxa ranged from 0.31 to 0.48 kg d ‾ 1; such exponential stage rates were also maintained for about 4 years ( Fig. 2 View Figure 2 ). Optimization of growth rates onto the two current phylogenetic hypotheses of tyrannosaurid relationships suggests that a 1.5-fold acceleration in maximal growth rate might diagnose Tyrannosaurinae (the clade comprising Daspletosaurus and Tyrannosaurus 13, 19, Fig. 2 View Figure 2 ). A second substantial increase in growth rate optimizes as a physiological autapomorphy of Tyrannosaurus irrespective of phylogenetic hypothesis and optimization criterion.
T. rex is notable for its great size, which is at least 15-fold greater than the largest living terrestrial carnivorous animals today and second only to Giganotosaurus 26 among theropod dinosaurs. How did it attain such great proportions within the Tyrannosauridae ? From the two competing hypotheses of tyrannosaurid phylogeny it is most parsimonious to conclude that T. rex acquired the majority of its giant proportions after diverging from the common ancestor of itself and D. torosus , a species with an optimized body mass of about 1,800 kg. Direct comparison between the tyrannosaurid growth curves shows that the transition to the exponential and stationary phases of development occurred about 2–4 years later in T. rex ( Fig. 2 View Figure 2 ). However, such temporal post-displacement had little to do with the evolution of its gigantism because the exponential stage, during which most body size is accrued 25, was not extended beyond the ancestral, 4-year condition observed in other tyrannosaurids. Rather, the key developmental modification that propelled T. rex to giant proportions was primarily through evolutionary acceleration in the exponential stage growth rate and the transition zones bounding it. This is reflected in the regions of maximal slope on the growth curves depicted in Fig. 2 View Figure 2 and holds true regardless of which evolutionary hypothesis is correct and how the maximum growth rates are optimized. Notably, this method of attaining gigantism contrasts with that in the largest crocodilians and lizards, where ancestral growth rates were retained and the exponential stages lengthened 27. How other dinosaurs attained gigantism within their respective sub-clades will serve as an interesting line of inquiry in the future. Does the same pattern of acceleratory growth seen here characterize the means by which all or most members of the Dinosauria attained great size?
...................................................................................................................................................................................................................................................................................................................................................................
Besides revealing how the evolution of T. rex gigantism was obtained, the data garnered here provide for a more comprehensive understanding of tyrannosaurid biology. For instance the presence of thin, tightly packed growth lines late in development ( Fig. 1 View Figure 1 ) shows that these animals, like nearly all (if not all) dinosaurs, had determinate growth 3, 14. They would not have gained an appreciably greater size than the largest specimens studied here and could spend nearly 30% of their lives as full-grown adults ( Fig. 2 View Figure 2 ). In addition, the maximal growth rates for these tyrannosaurid species are only 33–52% of the rates expected for non-avian dinosaurs of their size when compared with the more broadly sampled data of Erickson et al. 3. This provides the first evidence of its kind pointing to major differences in whole body growth rates among a non-avian dinosaur sub-clade. Such findings are not unexpected because similar patterns (for example primates within Eutheria) occur within living vertebrate groups 28. Our findings also have a bearing on the biomechanical capacities of tyrannosaurids. T. rex ’s capacity for ‘fast running’ was biomechanially infeasible after a body mass of about 1,000 kg was attained 11. This corresponds to a juvenile-sized animal just 13 years of age on the basis of our longevity data and conservative estimates of body mass ( Fig. 2 View Figure 2 ). If we assume that the same relationship held true for the smaller tyrannosaurid species studied here, such locomotory limitations would not have emerged until these animals were much closer to adult size ( Fig. 2 View Figure 2 ). Finally, a glimpse into the potential population age structure for a dinosaur is also afforded from these data. Currie 7 has described a catastrophic death assemblage consisting of eight or nine A. sarcophagus specimens thought to represent an entire pack or a subset of one. On the basis of femoral lengths, the age and developmental stage of each animal can now be estimated. The group seems to have consisted of two or three older adults ~21 or more years of age, one ~17-year-old young adult, four ~12–17- year-old sub-adults that were undergoing exponential stage growth at the time of death, and one ~10-year-old juvenile that was beginning the transition to exponential stage growth. A reopening of the site has revealed at least one more specimen (RTMP (Royal Tyrrell Museum of Palaeontology) 2002.45.46) shown here to be only 2 years old ( Table 1 View Table 1 ). This indicates that A. sarcophagus groups, whether temporary or permanent, might have been composed of individuals spanning the age spectrum from adolescents to very old, senescent adults, a finding consistent with trackway evidence for other theropod dinosaurs 7.
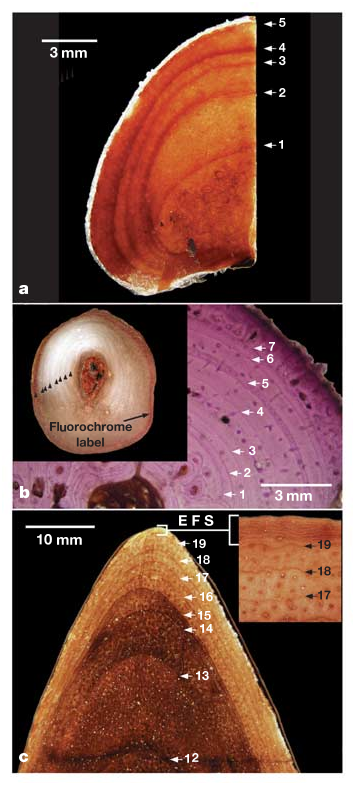

Table 1 Specimens, size measures, and longevity data
| Taxon Specimen no. Elements examined Femoral length (cm) Body mass (kg) Longevity (years); no. of growth lines in EFS ................................................................................................................................................................................................................................................................................................................................................................... | |||||
|---|---|---|---|---|---|
| Tyrannosaurus rex | FMNH PR 2081 | G, R, F, OLB | 134.5 | 5654 | 28; 9 |
| RTMP 81.12.1 | R, OLB | 128.4 est. | 5040 | 22 | |
| RTMP 81.6. 1 | G, R, OLB | 120 | 3230 | 18 | |
| ICM 2001.90. 1 | G, R | 116.8 est. | 2984 | 16 | |
| LACM 23845 View Materials | P, OLB | 98.9 | 1807 | 14 | |
| AMNH 30564 View Materials | G, R, F | 98 | 1761 | 15 | |
| LACM 28471 View Materials | R, C | 25.2 est. | 29.9 | 2 | |
| Gorgosaurus libratus | RTMP 94.12.602 | R, G, OLB | 91.6 | 1105 | 18 |
| RTMP 73.30.1 | F, OLB | 80.4 est. | 747 | 14 | |
| RTMP 99.33.1 | G, F, OLB | 75 | 607 | 14 | |
| RTMP 86.144.1 | R, F, OLB | 54.2 | 229 | 7 | |
| FMNH PR 2211 | G, R, F, OLB | 44.5 | 127 | 5 | |
| Albertosaurus sarcophagus | RTMP 81.10.1 | G, R, F, OLB | 89.5 | 1142 | 24; 2 |
| AMNH 5432 | P, F | 99.3 est. | 1282 | 22 | |
| USNM 12814/AMNH 5428 | R | 86.0 est. | 1013 | 18 | |
| RTMP 86.64.01 | R, F, OLB | 78.2 est. | 762 | 15 | |
| RTMP 2002.45.46 | F, OLB | 31.6 est. | 50.3 | 2 | |
| Daspletosaurus torosus | FMNH PR 308 | G, R | 96.0 est. | 1791 | 21; 5 |
| AMNH 5438 | R | 84.1 est. | 1518 | 17 | |
| RTMP 94.143.1 | G, OLB | 62.6 est. | 496 | 10 | |
FMNH, The Field Museum; RTMP, Royal Tyrrell Museum of Palaeontology; ICM, Indianapolis Children’s Museum; LACM, Los Angeles County Museum; AMNH, American Museum of Natural History; USNM, United States National Museum. R, rib; G, gastralia; F, fibula; P, pubis; C, dermal skull bones; OLB, other long bones; est., estimated; EFS, external fundamental system 16.
No known copyright restrictions apply. See Agosti, D., Egloff, W., 2009. Taxonomic information exchange and copyright: the Plazi approach. BMC Research Notes 2009, 2:53 for further explanation.
|
Kingdom |
|
|
Phylum |
|
|
Class |
|
|
Order |
|
|
Family |
|
|
Genus |