
Pinacosaurus grangeri, Gilmore, 1933
|
publication ID |
https://doi.org/10.1093/zoolinnean/zlad001 |
|
DOI |
https://doi.org/10.5281/zenodo.8146939 |
|
persistent identifier |
https://treatment.plazi.org/id/0395EB6D-3E71-FFA4-EEA4-E7D77D96F94A |
|
treatment provided by |
Plazi |
|
scientific name |
Pinacosaurus grangeri |
| status |
|
Pinacosaurus grangeri (ZPAL MgD-II/32)
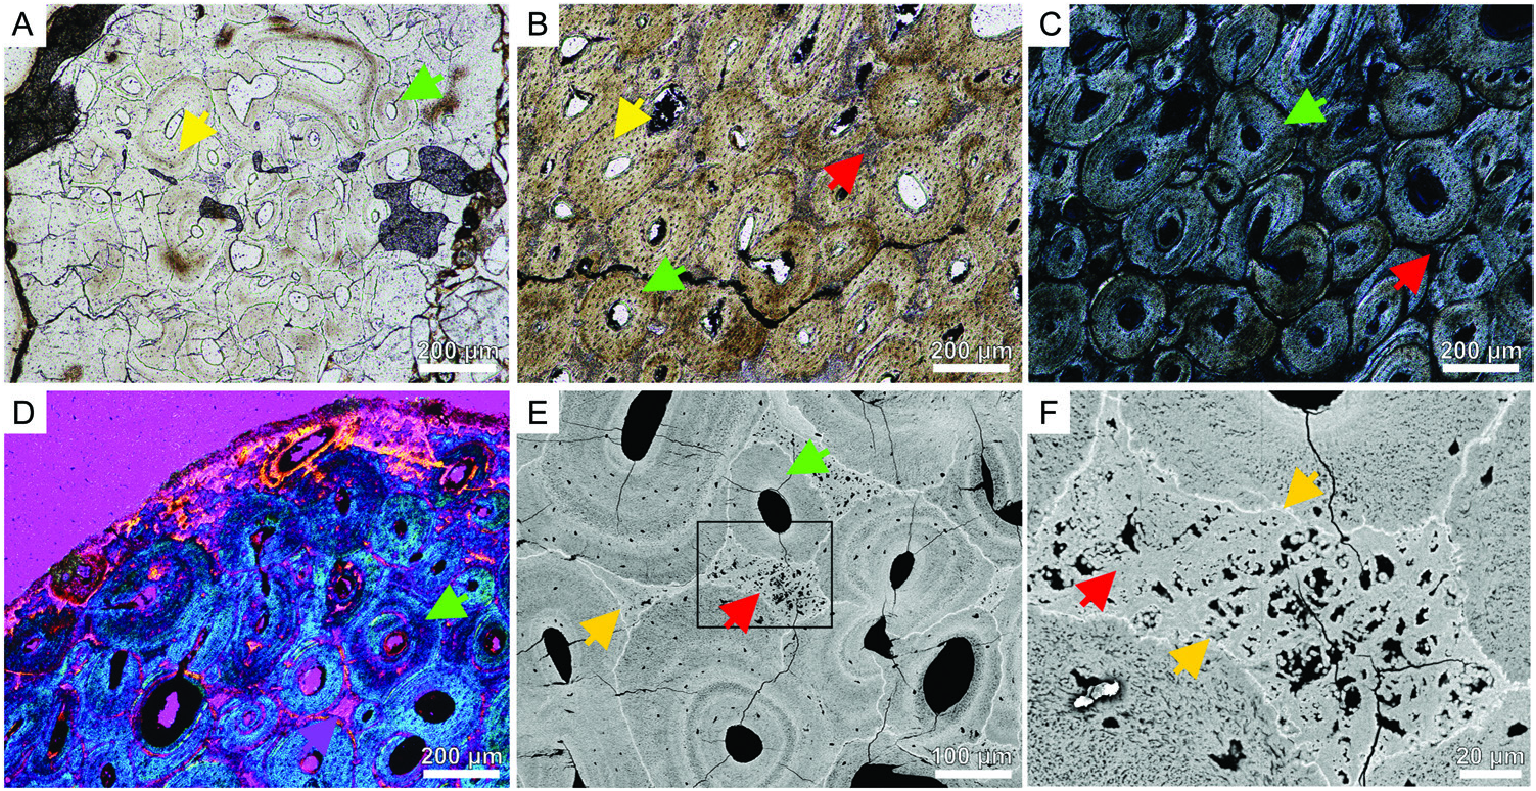
The caudal tendons reveal extensive secondary remodelling, with at least three generations of secondary osteons ( Fig. 3A–E View Figure 3 ). The cross-section of the flattened, elliptical tendon shows a densely secondary remodelled inner part ( Fig. 3B, C View Figure 3 ) in the thickest place and more loosely arranged secondary osteons in the thinner parts of the cross-section and the periphery of the tendon ( Fig. 3D View Figure 3 ). The latter is mainly composed of bundles of mineralized fibres and few vascular canals. Although, the secondary osteons mainly overlap each other in some places, between them patches of mineralized fibres are present (interfascicular spaces; Fig. 3E, F View Figure 3 ). The cross-section of the second sample from the same individual shows three circular tendons. The two bigger tendons (2.1 and 1.7 mm in diameter) are extensively secondarily remodelled ( Fig. 3A View Figure 3 ) and almost nonvascular mineralized fibres are present on their periphery. In contrast, the smallest tendon ( 0.6 mm in diameter) is exclusively composed of mineralized fibres, weakly vascularized. The difference in the structure between the smallest and two larger tendons result from different places of sectioning: the smallest is from the terminal part of the tendon, and the bigger ones closer to the middle part.
NANOSTRUCTURE OF THE TENDONS
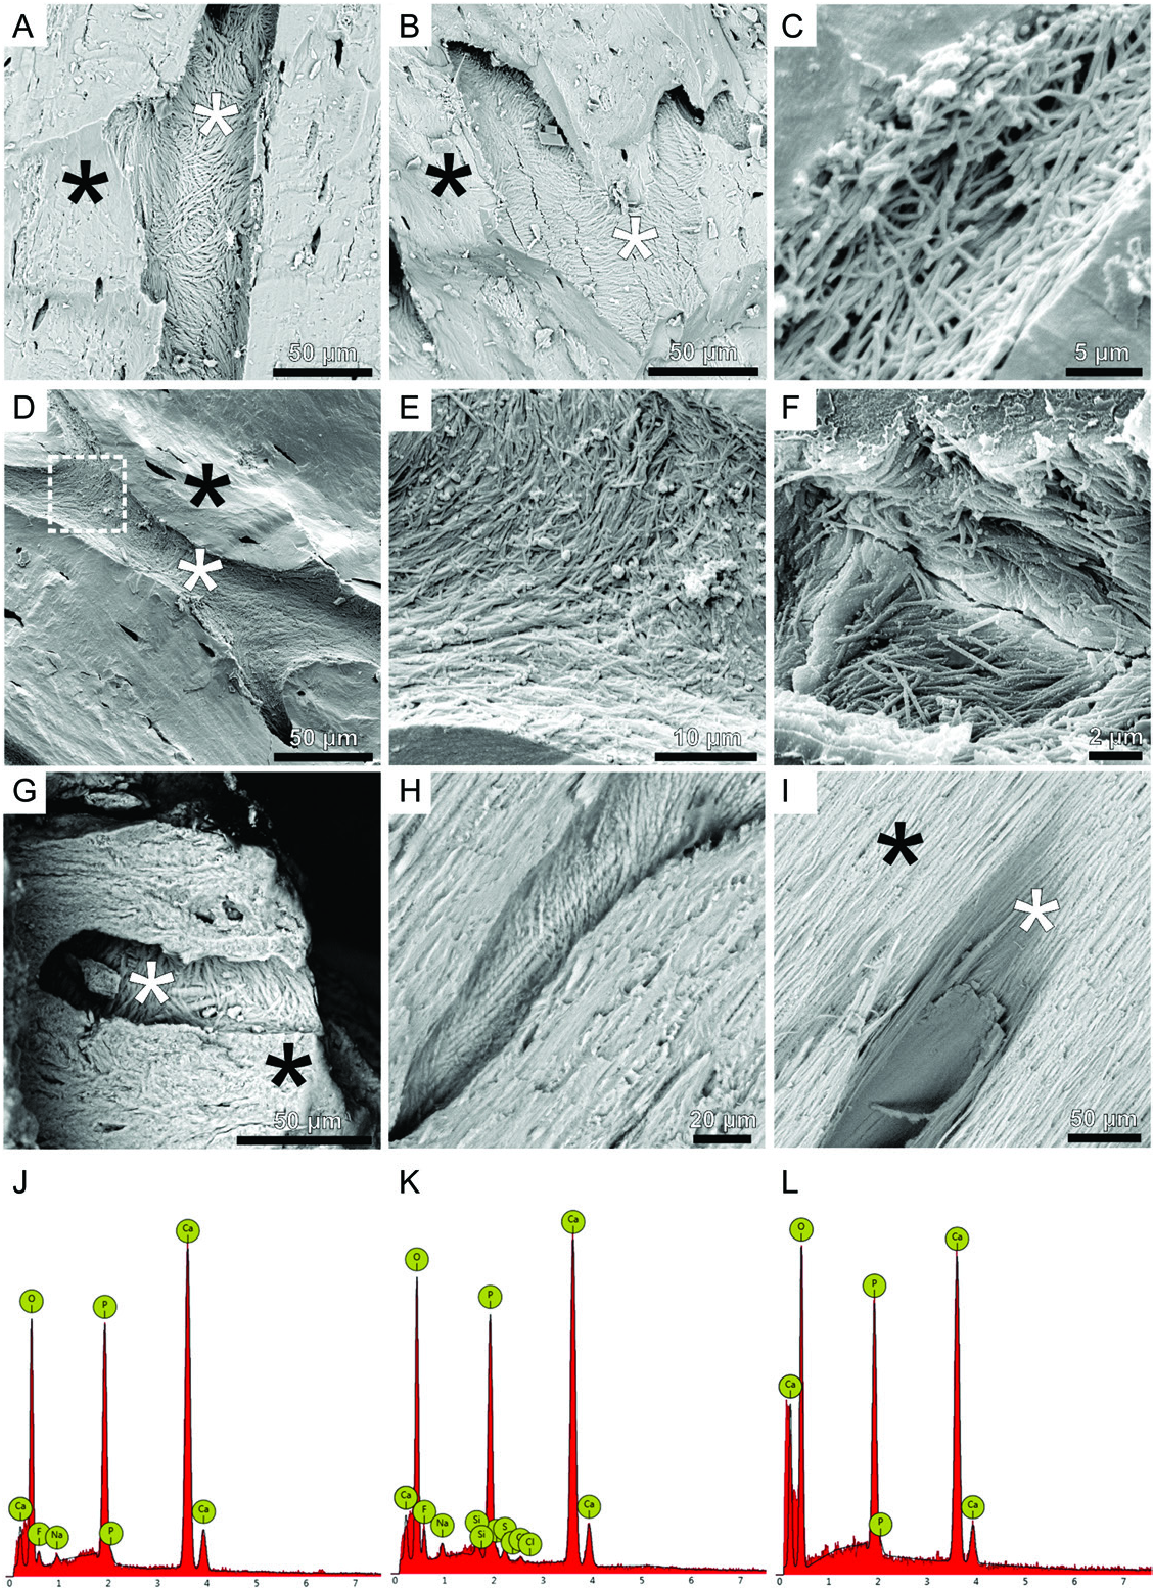
Detailed scanning electron microscopy (SEM) observation of vascular canals of fossilized tendons revealed the presence of mostly randomly oriented fibrous matrix in all three studied ornithischian samples ( Fig. 4A–G View Figure 4 ). Comparative SEM images of modern-day turkey tibialis cranialis tendons ( Fig. 4I–H View Figure 4 ) reveal similar fibrous structures. The observed structures exhibit a hierarchic pattern – individual fibres are gathered in bundles (or fascicles). The diameters of the bundles range from 0.7 to 2 µm (Supporting Information, Fig. S1 View Figure 1 ) and the bundles are located in the walls of vascular canals of diameters varying between a dozen and 50 µm. The fibrous structures are visible only in the vascular walls exposed on the surfaces of freshly broken tendons.
The EDS spectra collected from the fibrous structures and surrounding mineral matrix of all studied tendons reveal oxygen, calcium and phosphorus as the main components in all studied taxa ( Fig. 4K, L View Figure 4 ), which is a typical elemental signature of modern and fossil bones. To visualize vascular canal shape and geometry, topographic microscope imaging ( Fig. 5A, B View Figure 5 ) of a Homalocephale calathocercos tendon sample was applied. The results indicate that the observed fibrous structures are located deep inside the vascular canals exclusively and incorporated in their walls along their length. In addition to the surface morphology imaging, information of vascular canal topography in the tendon was collected using an atomic force microscope (AFM) in contact mode. The generated images (lock-in amplitude and lockin-phase, Fig. 5B–G View Figure 5 ) show the nanostructure of the fibres. Furthermore, AFM imaging on an individual fibre ( Fig. 5G, H View Figure 5 ) reveals its striped pattern and the performed measurements allow estimation of a periodicity measuring about 24 nm ( Fig. 5I, J View Figure 5 ; Supporting Information, Data S2).
PRESERVATION OF SOFT PARTS
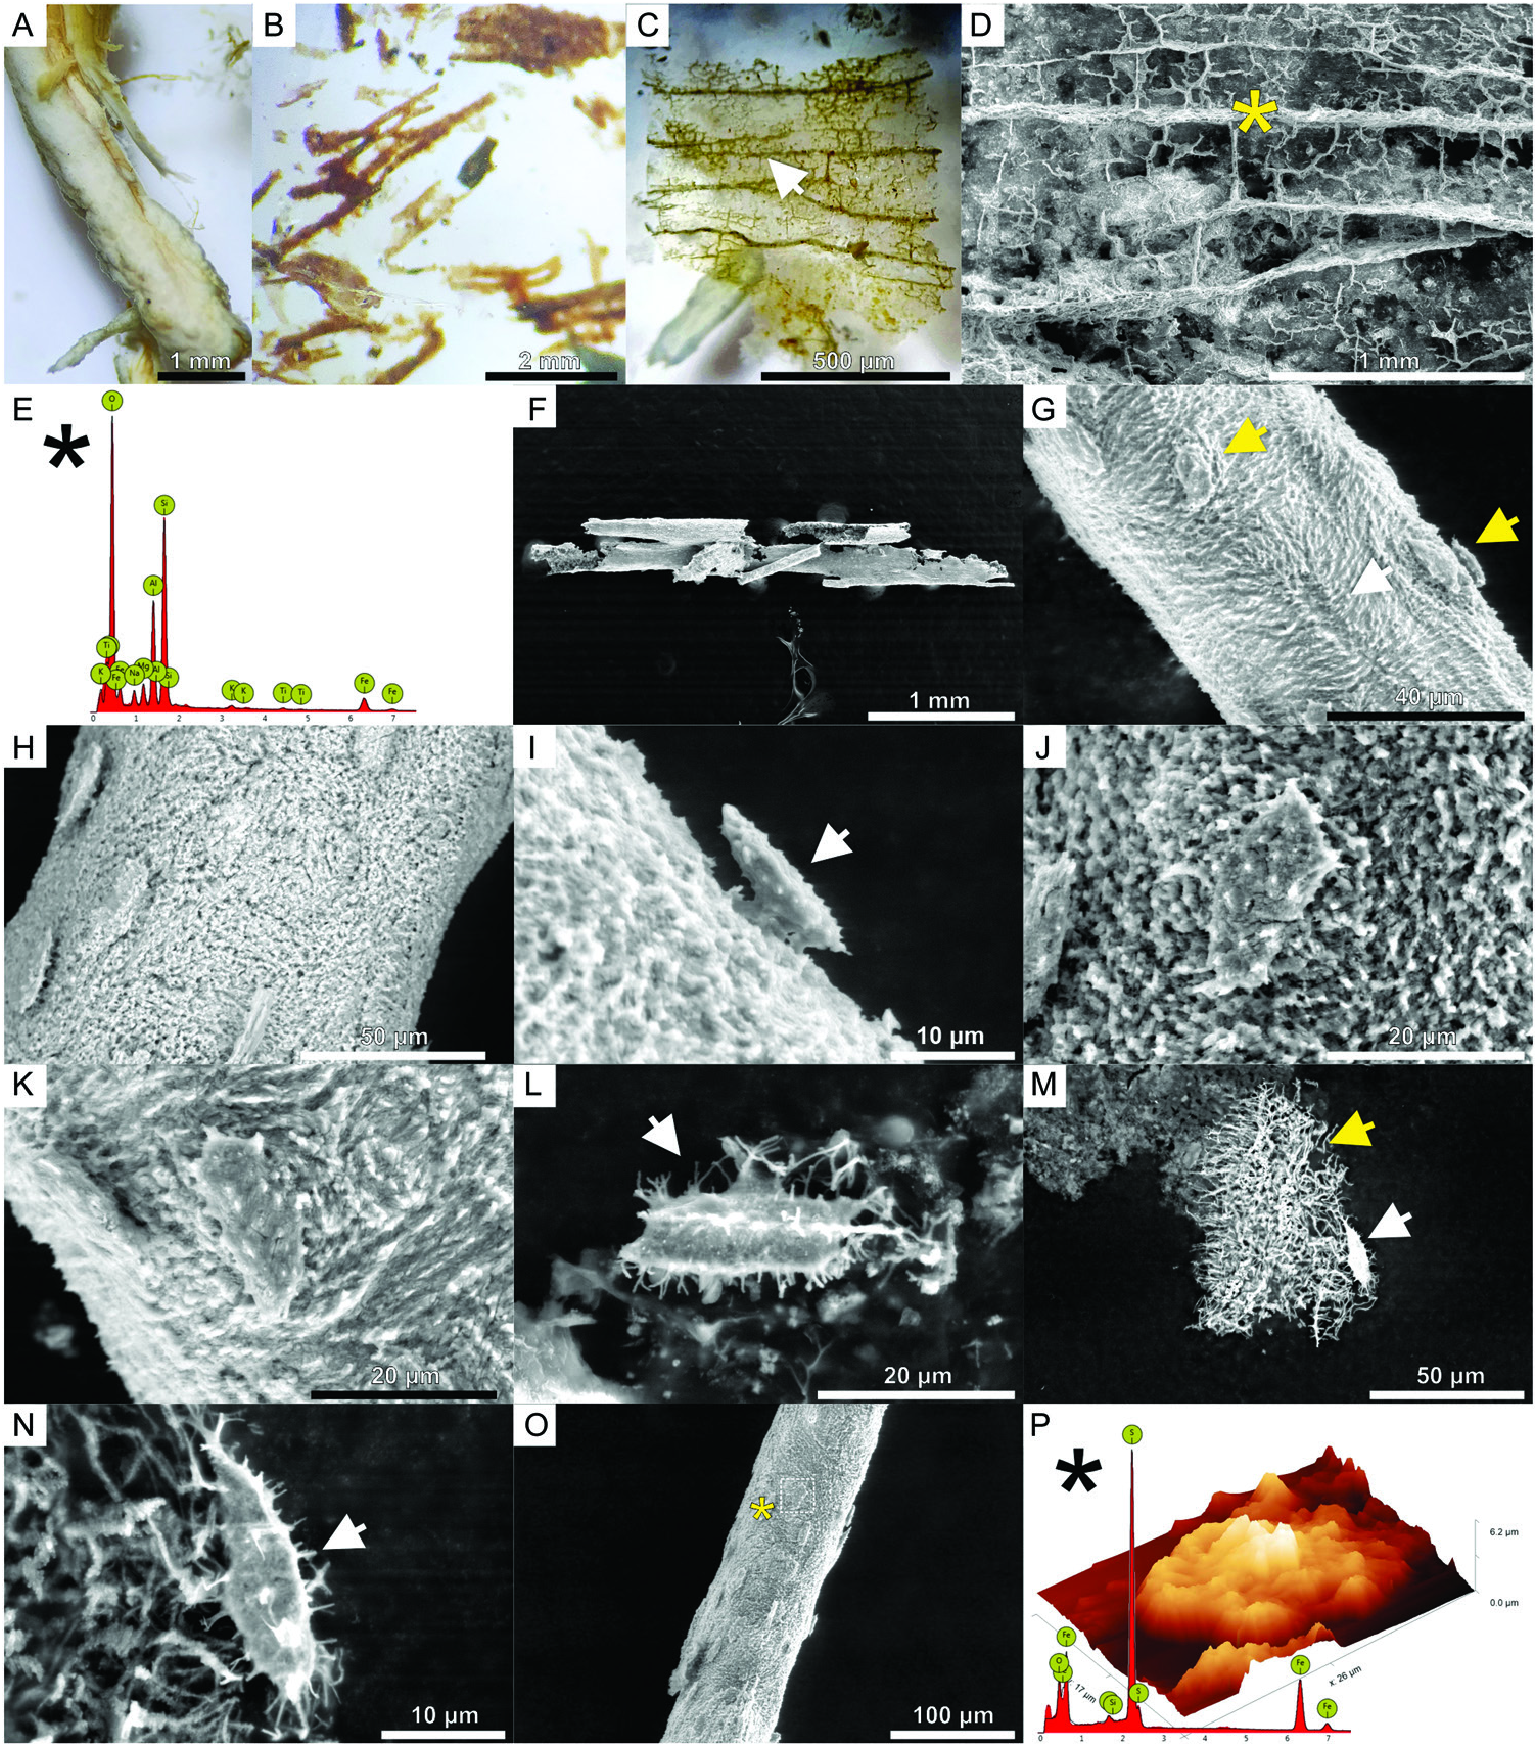
All fossil tendon samples were demineralized (see Material and methods) to remove the apatite matrix and to assess whether any soft parts were preserved. No fossilized soft parts were obtained from the extract of Pinacosaurus grangeri . The demineralization of the tendons of Homalocephale calathocercos ( Fig. 6A View Figure 6 ) revealed an extract consisting of individual brown- to orange-coloured tubular structures, as well as a dense network of vascular canals still attached to a translucent layer loosening from the tendon ( Fig. 6C, D View Figure 6 ; Supporting Information, Fig. S2 View Figure 2 ). Furthermore, the Edmontosaurus regalis sample revealed the presence of numerous rust- to brown, dark to translucent, elongated, bifurcated and H-shaped structures ( Fig. 6B View Figure 6 ). Additionally, over a dozen tubular, branched structures ( Fig. 6C, D View Figure 6 ) seems to be morphologically consistent with blood vessels or fibril bundle layers lining the vascular canals observed with SEM. Among them, ovate to tent-shaped cell-like structures attached to the surfaces of vessels or bundle layers were found ( Fig. 6F–K View Figure 6 ). Other cell-like structures, more spindle-shaped, and projecting branching structures ( Fig. 6L–N View Figure 6 , black asterisks) were usually observed in isolation ( Fig. 6L, N View Figure 6 ), sometimes attached to the fibrous matrix. The EDS spectra collected from the demineralized parts of the tendons show that their elemental composition is different from the mineral matrix of the tendons. In the case of the external sheath of a partially demineralized tendon of H. calathocercos , which detached from the tendon, a dense network of vessel-like tubes was observed ( Fig. 6C, D View Figure 6 ; compare also: Supporting Information, Fig. S2A, B View Figure 2 ). In this sample, oxygen, silicon and aluminium dominate ( Fig. 4E View Figure 4 ), while remains of phosphates are still present (Supporting Information, Fig. S2C View Figure 2 ). The fossilized vascular-like tubular structures with attached cell-like structures ( Fig. 6F–K View Figure 6 ), as well as individual cells ( Fig. 6L–N View Figure 6 ) extracted from the samples taken from E. regalis and H. calathocercos , are composed mainly of iron and sulphur with smaller addition of oxygen and silicon ( Fig. 6P View Figure 6 ).
ORGANIC MATTER RESIDUES
Total carbon (TC), total organic carbon (TOC) and total inorganic carbon (TIC), as well as total sulphur (TS), contents were measured (see Material and methods) to document the preservation of organic matter in all studied fossil samples. Obtained results demonstrate TOC values equal to 1.28 wt% for Homalocephale calathocercos , 2.57 wt% for Pinacosaurus grangeri , and 2.81 wt% for Edmontosaurus regalis tendon samples. An elevated level of total sulphur (4.54 wt%) was also reported for the latter. Furthermore, the control sample of sediment associated with E. regalis tendons reveals the highest level of TOC, up to 6 wt% with sulphur content below 0.5 wt%.
SPECTROSCOPIC STUDIES AND MASS SPECTROMETRY
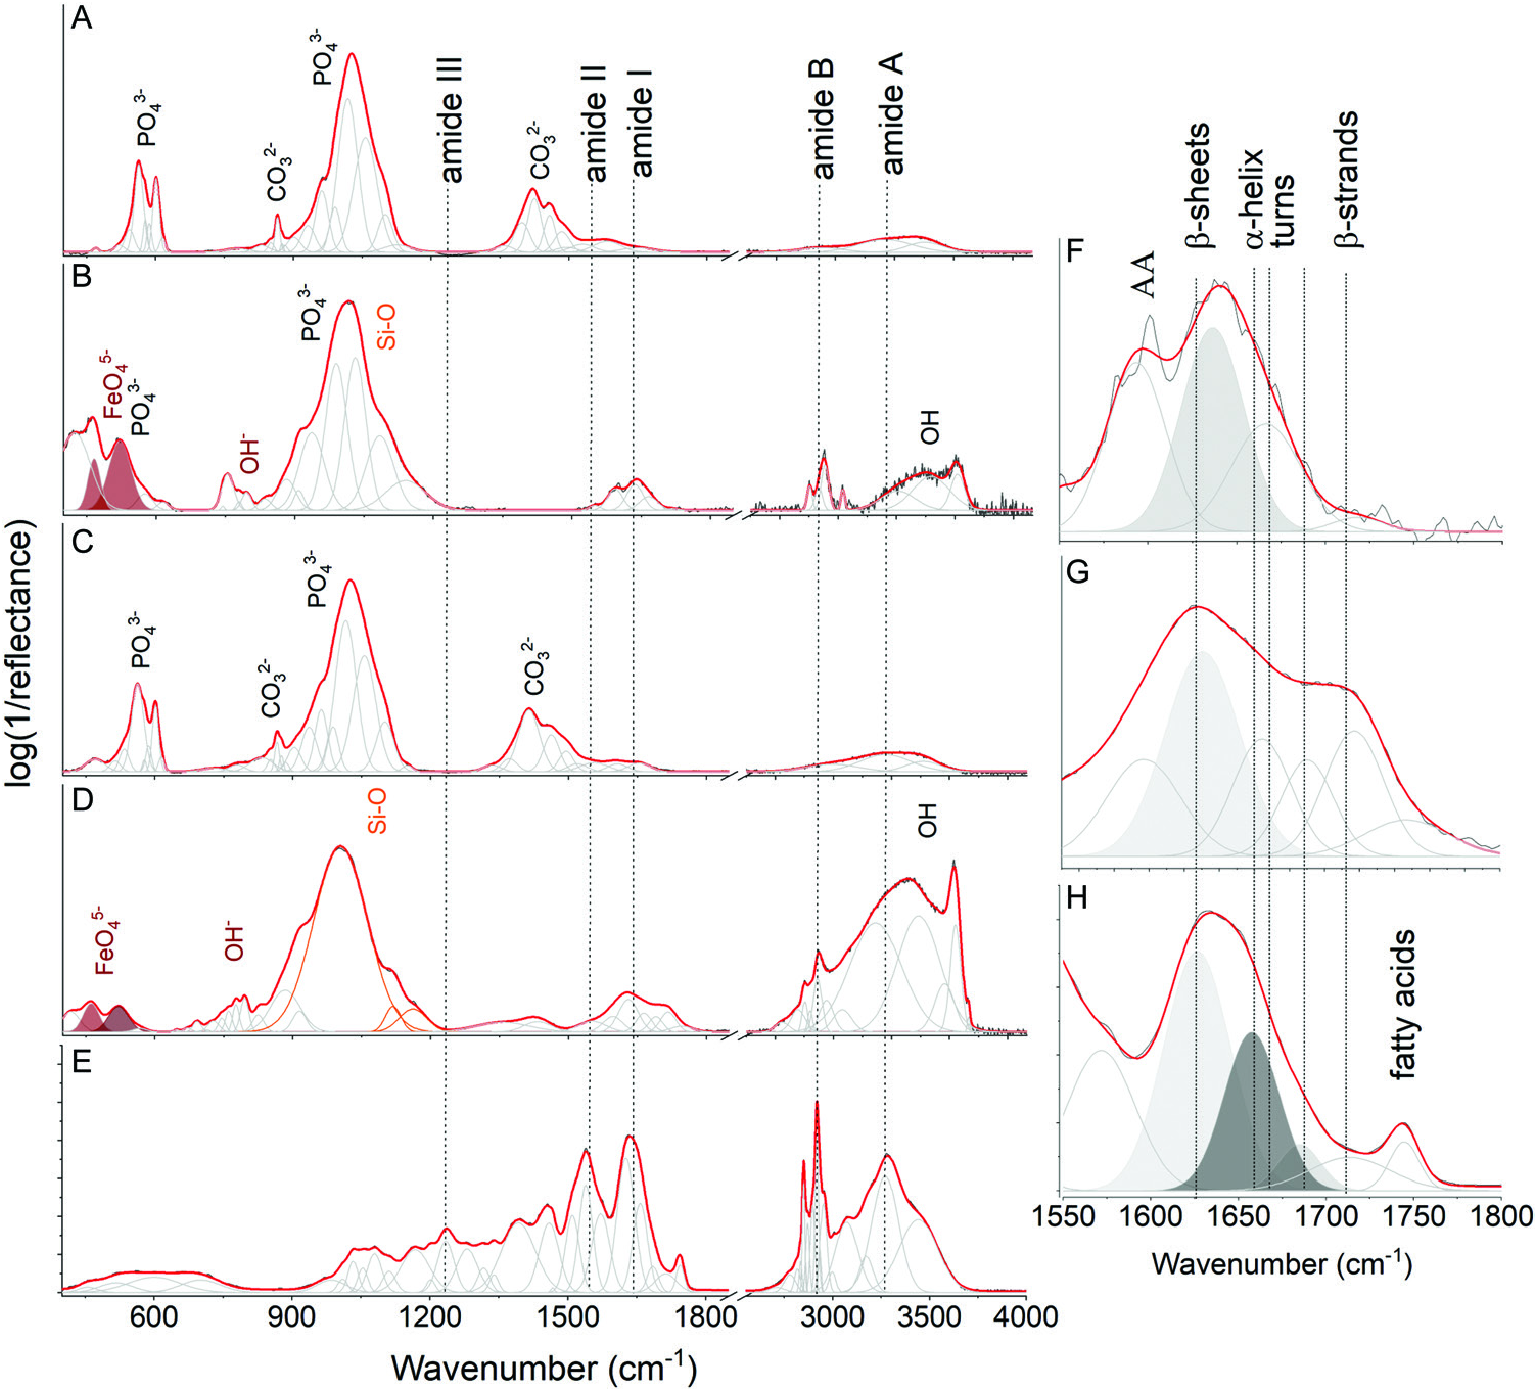
FTIR spectroscopic studies, intended mainly to identify organic residues in the fossil samples, were performed only on the selected tendon samples that were never glued or treated with any organicbased materials (e.g. consolidants). Therefore, the Pinacosaurus grangeri tendon sample was not included (Supporting Information, Data S3). A modern-day turkey ( Meleagris gallopavo , GIUS-12-3741) was a control sample. FTIR studies of H. calathocercos , E. regalis and M. gallopavo show a band arrangement pointing to co-association of various minerals, including phosphate (PO 4) 3–, carbonate (CO 3) 2– and iron oxide (FeO 4) 5–, as well as silicon dioxide (SiO 2) moieties, suggesting the presence of carbonate apatite, goethite and silicates ( Fig. 7 View Figure 7 ). The results are thus consistent with the EDS spectra ( Fig. 4H, L, P View Figure 4 ) for the same samples. The FTIR measurements of demineralized parts of tendon samples from H. calathocercos and E. regalis revealed also signals associated with organic residues ( Fig. 5B, D View Figure 5 ), especially well visible due to several bands in the 1550–1800 cm –1 corresponding to the amide I ( Fig. 7F, G View Figure 7 ). A percentage proportion of each component in the amide I band was computed as a ratio of a fractional area of the suitable peak after the band fitting and the sum of the areas of the peaks belonging to the amide I band ( Byler & Susi, 1986; Jackson & Mantsch, 1995; Litvinov et al., 2012). As a result, two intensive bands were observed at 1633 and 1668 cm –1 with 64 and 36% proportion between β- sheet structures and turns ( Litvinov et al., 2012) for H. calathocercos , as well as three bands at 1630, 1663 and 1690 cm –1 with 56, 25 and 19% for E. regalis . Two other marginal bands (at 1594 and 1714 cm –1) were also detected in both samples and correspond to the lipid signal, including fatty acids. The comparison of the fossilized tendons with the turkey tendon ( Fig. 7E, H View Figure 7 ) strongly support the possibility of organic (proteinaceous) preservation in the fossil samples, especially based on the comparison of the amide I fingerprint region ( Fig. 7F–H View Figure 7 ).
Mass spectra (Supporting Information, Data S4) were collected both from the demineralized sample of H. calathocercos and E. regalis tendons across the regions of interest with a mass-to-charge ratio ( m / z) range of 1–150 Da, the fingerprint region for lower mass amino acid anions ( Surmik et al., 2017). There, various non-organic (Si-containing and Fe-containing), as well as organic (N-containing), species were identified. The detected ions CH 4 N + (at m / z 30.03 Da), C 2 H 3 N + (at m / z 41.03 Da), C 2 H 6 N + (at m / z 44.05 Da), C 3 H 3 N + ( m / z 53.02 Da), C 3 H 6 N + (at m / z 56.04 Da), C 4 H 6 N + (at m / z 68.05 Da), C 4 H 8 N + (at m / z 70.07 Da), C 4 H 10 N + (at m / z 72.08 Da) and C 5 H 10 N + (at m / z 84.08 Da) are related to amino-acids ( Surmik et al., 2017) (see also fibrous matrix (white arrow) and cell-like structures attached to the surface (yellow arrows); H, group of cells-like structures attached to the surface; I, lateral view of a cell-like structures (white arrow) attached to the fibrous surface of the vessel-like structures; J, K, examples of cells on the fibrous surface of vessels; L–N, osteocyte-like cells with branching cytoplasmic processes (white arrows) attached to the fibrous matrix (yellow arrow); O, example of isolated vessel-like tubular structure with attached cells (yellow asterisk indicate spot for EDS survey); P, AFM 3D height profile of an individual cell (rectangle in O) documenting the height difference between the cell and the surface of the vessel; the EDS spectrum revealing the elemental composition of the studied cell as iron and sulphur with addition of oxygen and silicon.
Supporting Information, Data S4). The presence of the Si- and Fe-containing species correlates with the results of the EDS surveys ( Fig. 6E, P View Figure 6 ) and confirms the mineralogical composition of the studied samples.


No known copyright restrictions apply. See Agosti, D., Egloff, W., 2009. Taxonomic information exchange and copyright: the Plazi approach. BMC Research Notes 2009, 2:53 for further explanation.
|
Kingdom |
|
|
Phylum |
|
|
Class |
|
|
Order |
|
|
Family |
|
|
Genus |