
Parazoanthus swifti Salmon
|
publication ID |
https://doi.org/10.1111/j.1096-3642.2008.00513.x |
|
persistent identifier |
https://treatment.plazi.org/id/03B787ED-4A15-A06D-FF0D-50A1A8C51372 |
|
treatment provided by |
Felipe |
|
scientific name |
Parazoanthus swifti Salmon |
| status |
|
Parazoanthus swifti Salmon Florida (gulf), USA
Parazoanthus swifti White Florida (gulf), USA Parazoanthus swifti Yellow Navassa, USA Parazoanthus swifti Yellow Bocas del Toro, Panamá
Parazoanthus swifti Orange Bocas del Toro, Panamá
Parazoanthus swifti Orange Tobago
Parazoanthus swifti Orange Tobago
Parazoanthus swifti CUR 200 Orange Tobago
Parazoanthus swifti TOB 42 Yellow Tobago
Parazoanthus swifti CUR 200 Yellow US Virgin Islands, USA
Parazoanthus tunicans White Curaçao
Parazoanthus tunicans White Dominica
Parazoanthus tunicans White Tobago
Zoanthus pulchellus Bocas del Toro, Panamá Zoanthus sansibaricus Japan
Zoanthus kuroshio Japan
Zoanthus gigantus Japan
Edwardsiidae sp. (BAR) Transparent Barbados
Edwardsiidae sp. (BAR) Transparent Barbados
Edwardsiidae sp. (BAR) Transparent Barbados
Edwardsiidae sp. (CUR) Transparent Curaçao
Callyspongia (Cladochalina) EU 418307 USVI 148 vaginalis (Lamark, 1814)
Agelas sp. EU418308 View Materials BAR 120 Svenzea zeai (Alzerez, van EU418309 View Materials CUR 212 Soest, & Rützler, 1998)
Svenzea zeai (Alzerez, van EU418310 View Materials DOM 7 Soest, & Rützler, 1998)
Agelas conifera (Schmidt, EU418311 View Materials DOM 12 1870)
Agelas sceptrum ( Lamark, EU418312 View Materials EU828758 View Materials NAV 58 1815)
Agelas conifera (Schmidt, EU418313 View Materials TOB 35 1870)
Svenzea zeai (Alzerez, van EU418314 View Materials TOB 36 Soest, & Rützler, 1998)
Iotrochota birotulata EU 418315 BAR 121 (Higgin, 1877)
Red encrusting EU418316 View Materials BRA 163 Poecilosclerida
Red encrusting EU418317 View Materials BRA 165 Poecilosclerida
Clathria (Clathria) prolifera EU 418318 C&G 129 (Ellis & Solander, 1786)
Clathria sp. EU418319 View Materials C&G 131 Orange encrusting EU418321 View Materials CUR 200 Poecilosclerida
Iotrochota birotulata EU 418320 CUR 204 (Higgin, 1877)
Agelas sp. EU418322 View Materials DOM 11 Poecilosclerida EU 418323 FLG 5 Poecilosclerida EU 418324 FLG 7 Clathria sp. EU418325 View Materials FLG 9 Orange Poecilosclerida EU 418326 FLG 13 Orange encrusting EU418327 View Materials FLG 50 Poecilosclerida
Yellow branching EU418328 View Materials FLG 53 Poecilosclerida
Black branching EU418329 View Materials FLG 54 Poecilosclerida
Orange Poecilosclerida EU 418330 FLG 55 Agelas sp. EU418331 View Materials NAV 56 Iotrochota birotulata EU 418332 EU828755 View Materials PAN 9 (Higgin, 1877)
Clathria (Thalysias) EU 418333 PAN 11 schoenus (de Laubenfels,
1936)
Iotrochota birotulata EU 418334 TOB 39 (Higgin, 1877)
Topsentia ophiraphidites (de EU418335 View Materials TOB 41 Laubenfels, 1954)
Agelas clathrodes (Schmidt, EU418336 View Materials TOB 42 1870)
Topsentia sp. EU418337 View Materials TOB 45 Clathria (Thalysias) EU 418338 USVI 151 juniperina (Lamark, 1814)
Dentitheca dendritica EU 418339 CUR 71 ( Nutting, 1900)
Dentitheca dendritica EU 418340 DOM 30 ( Nutting, 1900)
Dentitheca dendritica EU 418341 EU828760 TOB 40 ( Nutting, 1900)
EU828762 View Materials PAN 7
AB235412 View Materials
AB235410 View Materials
AB235411 View Materials
Plakortis sp. EU418268 View Materials BAR 05A Plakortis sp. EU418269 View Materials EU828764 View Materials BAR 06W Plakortis sp. EU418270 View Materials BAR 06Y Plakortis sp. EU418271 View Materials CUR 213
using a cetyl-trimethyl-ammonium bromide extraction technique ( Doyle & Doyle, 1987). Polymerase chain reaction (PCR) amplification was performed using the Platinum® PCR Supermix (Invitrogen) and the following primers: novel primers designed for anthozoan complete ITS (ITSf, 5 ′ -CTAGTAAGCGCGA GTCATCAGC-3 ′; ITSr, 5 ′ -GGTAGCCTTGCCTGATC TGA-3 ′), novel primers designed for anthozoan 16S (16Sf 2824, 5 ′ -TCGACTGTTTACCAAAAACATAGC- 3 ′; 16Sr 3554, 5 ′ -CAATTCAACATCGAGGTCGCAA AC-3 ′), and the 16S primers of Sinniger et al. (2005). The thermal protocol used for all primers consisted of 94 °C for 3 min, 32 cycles of 94 °C for 30 s, 50 °C for 60 s, 72 °C for 90 s, with a final extension step of 72 °C for 10 min. The PCR products were purified by enzymatic digestion (ExoSAP-IT®; USB Corporation), and were directly sequenced in both the forward and reverse directions using the amplification primers and Big-Dye® Terminator (Applied Biosystems) chemistry at the Florida State University Sequencing Facility.
PHYLOGENETIC ANALYSES
Forward and reverse sequences were edited and assembled using SEQUENCHER 4.0.5 (Gene Codes Co.), and an initial alignment of all sequences was made using CLUSTAL X 1.81 ( Thompson et al., 1997) with the default settings. The CLUSTAL X-derived alignment was adequate for 16S, 5.8S, the 3 ′ end of 18S, and the 5 ′ end of 28S for all sequences; however, the ITS1 and ITS2 regions could only be reasonably aligned by CLUSTAL X within groups of individuals that represented species or closely related species. Phylogenetic analyses of ITS regions often exclude large portions of ITS1 and ITS2 because of alignment difficulties (e.g. Reimer et al., 2007). In order to include all nucleotides of the ITS genes in the phylogenetic analyses, blocks of unambiguously aligned sequences were shifted to create non-overlapping character sets in the alignment, and the resulting gaps were coded as missing characters using BIOEDIT 7.0.5.2 ( Hall, 1999). The final ITS alignment contains the complete sequence of each individual, but regions that aligned among subsets of individuals were staggered throughout the alignment, in an organization analogous to a concatenated multigene alignment, with incomplete taxon sampling for each gene (see Fig. S1 View Figure 1 for a schematic of ITS alignment). Exact duplicate haplotypes were removed from the ITS alignment (indicated by superscript notations in Table 1), and were not included in further analyses.
Model selection and parameter estimation were performed using the Akaike information criterion in MODELTEST 3.7 ( Posada & Crandall, 1998). The Tamura–Nei model ( Tamura & Nei, 1993) with invariable sites and gamma parameter (TrN + I + G) gave the best fit to the ITS data, with the following parameters: base frequencies, A = 0.2270, C = 0.2626, and G = 0.2704; substitution-rate matrix, rAC = 1.0000, rAG = 2.1157, rAT = 1.0000, rCG = 1.0000, and rCT = 2.8980; gamma shape parameter, 0.4557; proportion of invariable sites, 0.3616. The Tamura–Nei model ( Tamura & Nei, 1993) with gamma parameter (TrN + G) gave the best fit to the 16S data, with the following parameters: base frequencies, A = 0.3112, C = 0.1900, and G = 0.2566; substitution-rate matrix, rAC = 1.0000, rAG = 4.5496, rAT = 1.0000, rCG = 1.0000, and rCT = 8.6916; gamma shape parameter, 0.3976. Phylogenetic analyses were conducted using PAUP 4.0 b10 ( Swofford, 2000) and MRBAYES 3.1.2 ( Huelsenbeck & Ronquist, 2001). Maximum likelihood (ML) searches were performed using a heuristic search algorithm with tree-bisection-reconnection branch swapping and five random-sequence taxon additions. Estimates of support were obtained by ML bootstrapping using the same likelihood parameters as the topology search, with 100 pseudoreplicates, and a Bayesian statistical approach using Markovchain Monte Carlo simulations ( Huelsenbeck & Ronquist, 2001). Bayesian analyses of the ITS data were performed on an alignment partitioned into three data subsets (ITS1; ITS2; and a concatenated 18S, 5.8S, and 28S), using models of molecular evolution empirically determined for each partition by MRBAYES. Every five-hundredth tree was sampled during a 5 million iteration chain, and, after inspection for convergence using AWTY ( Wilgenbusch, Warren & Swofford, 2004), the first two million iterations were discarded as ‘burn-in’. A 50% majority rule consensus tree was calculated from the remaining Bayesian iterations using PAUP.
SPECIES DELIMITATIONS AND BIOGEOGRAPHY
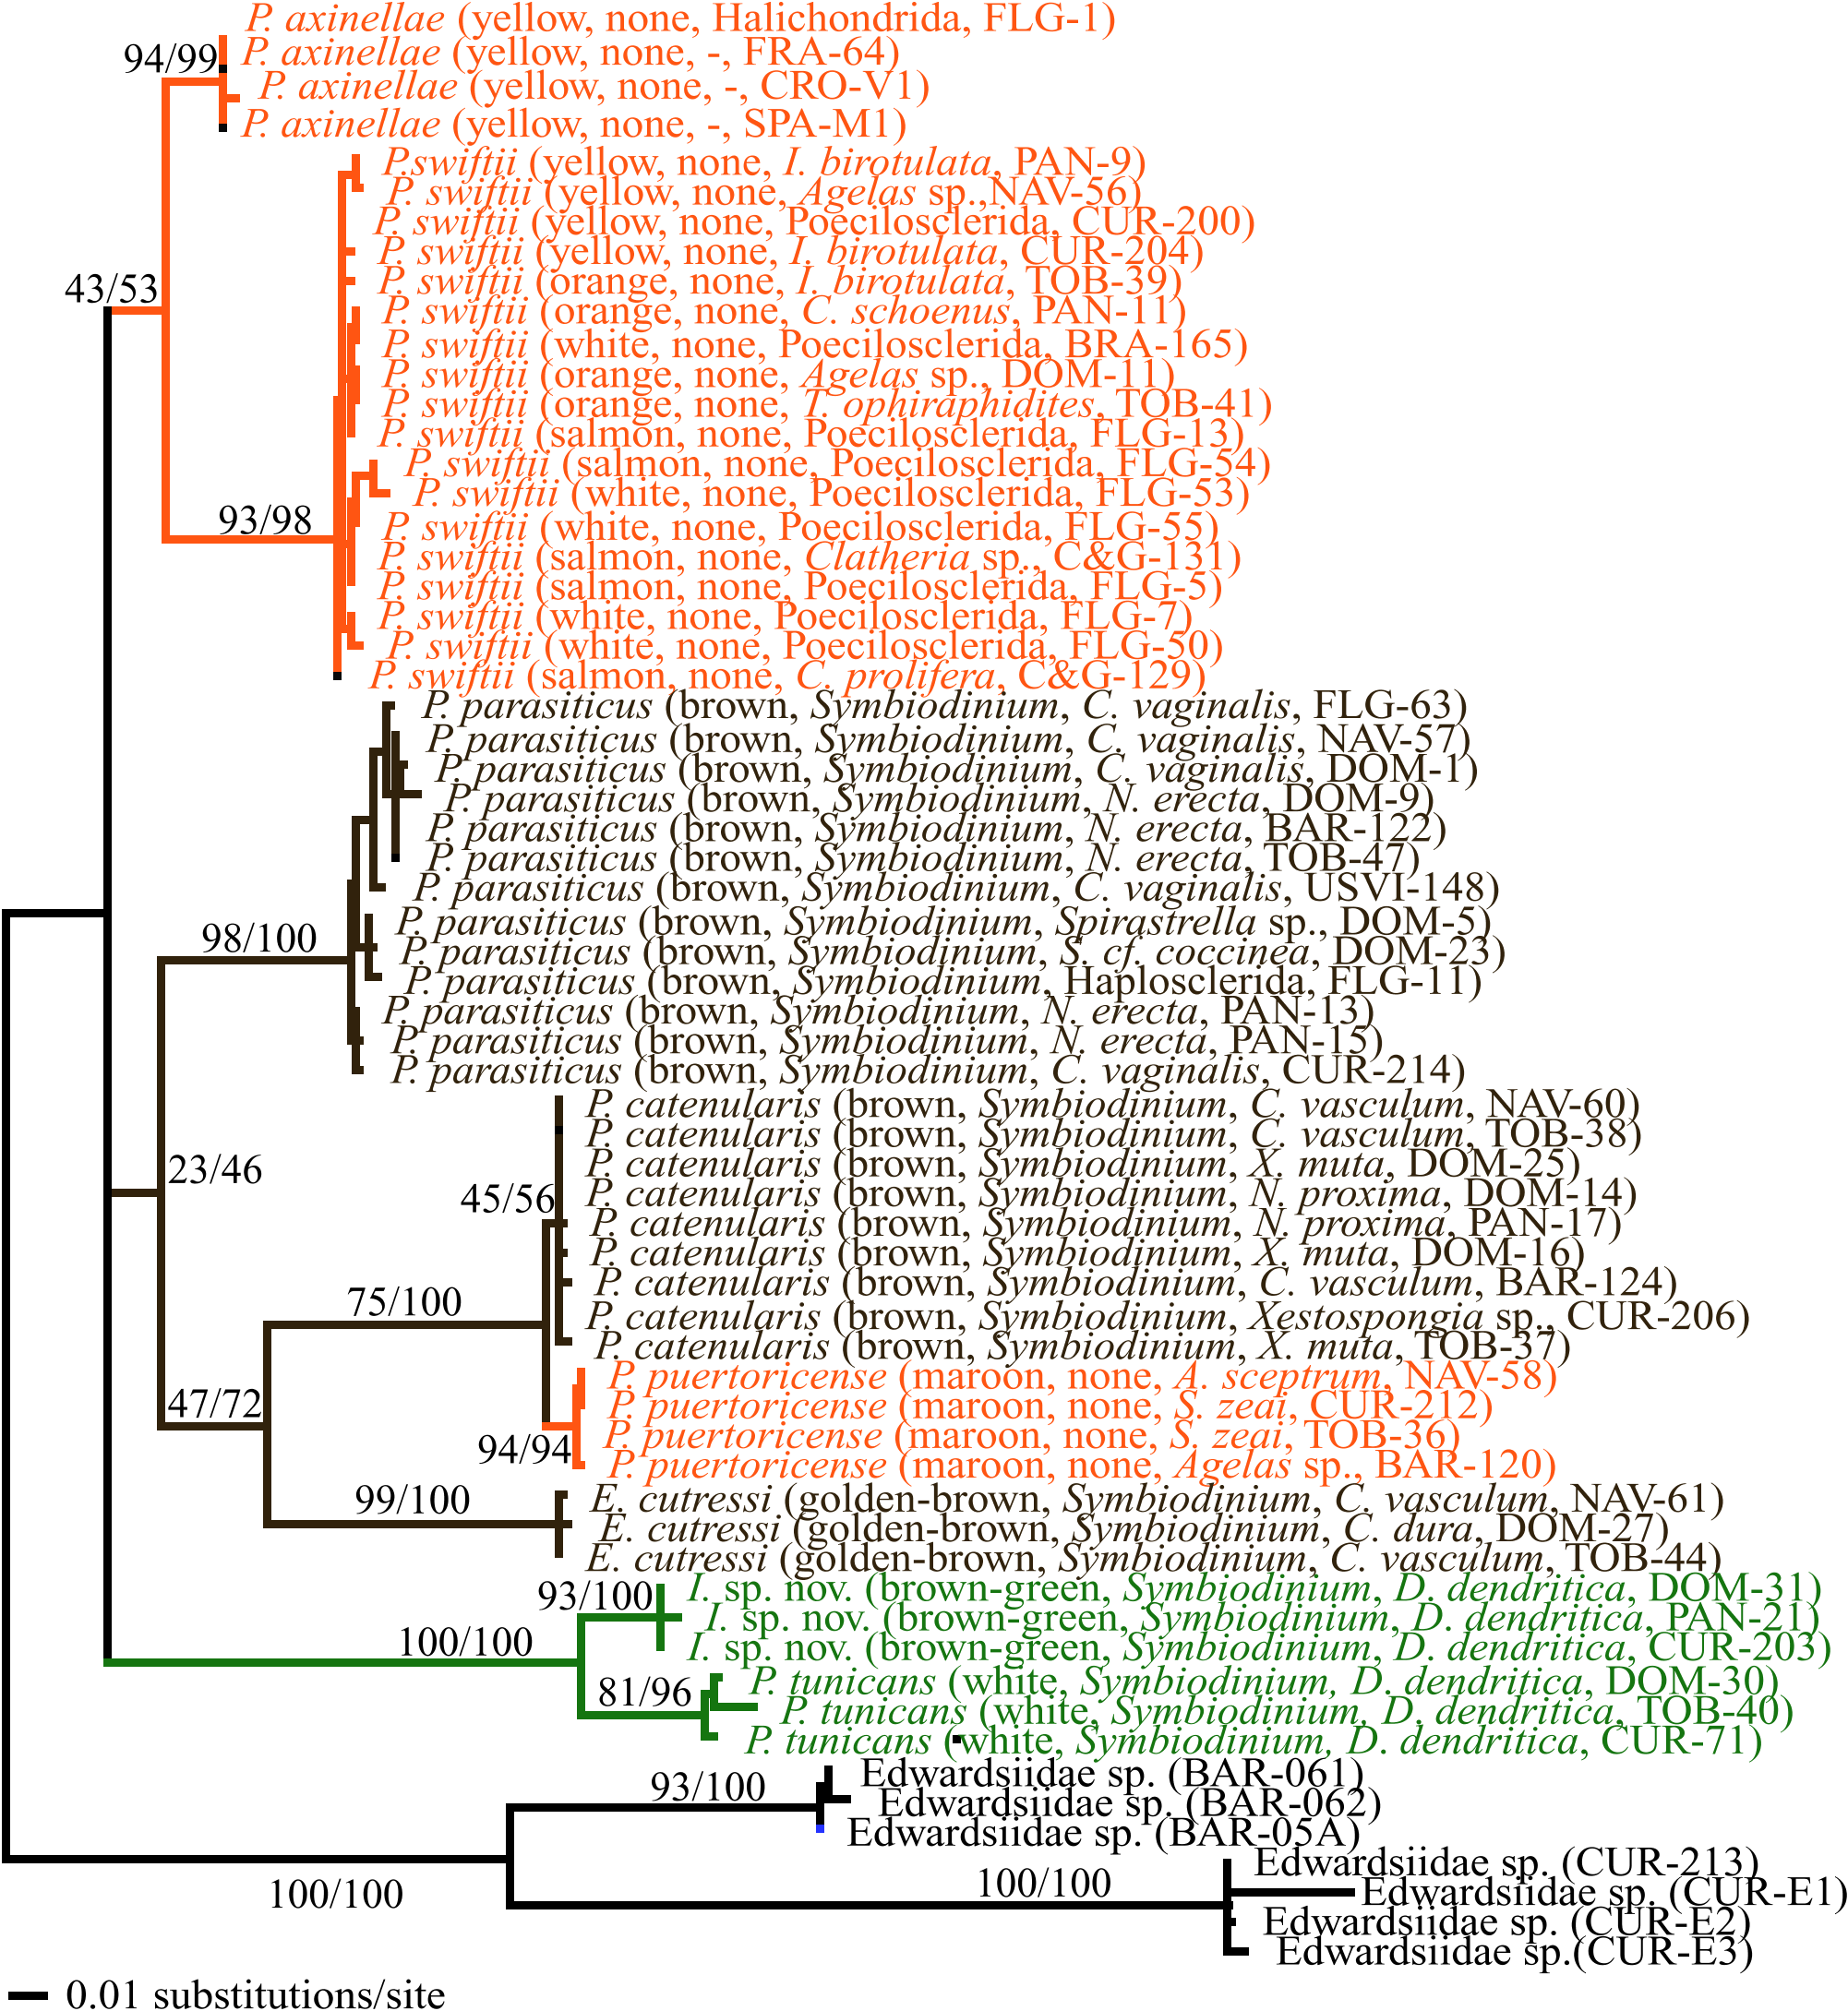
Species delimitations were determined from the ITS phylogeny using a history-based phylogenetic species concept ( Baum & Donoghue, 1995) by identifying reciprocally monophyletic crown clades, which were then assessed by concordance with published descriptions of gross morphology (colour, number of tentacles, number of scapular ridges, and size of polyps). Individual zoanthids were initially identified in situ by field observations and macroscopic photography of zoanthid–host holobionts, using a combination of polyp and colony morphology, and host specificity, as described by Duerden (1900), Pax & Müller (1962), West (1979), Crocker & Reiswig (1981), and Swain & Wulff (2007).
Species that did not match published morphological descriptions of Caribbean zoanthids were subjected to further microscopic examination of internal morphological structures. Individual polyps were decalcified in a formic acid fixative decalcifier (Formical-4™; Decal Chemical Corporation) for 4 h, and were then desilicified in 10% hydrofluoric acid for 4 h, before being stored in 70% ethanol. Polyps were dehydrated, stained with Harris’ hematoxylin and eosin, imbedded in paraffin, and sectioned at the Florida State University Histology Facility. Longitudinal and crosssectional serial sections were made from several different polyps from each colony sampled for histology, at a thickness of 8–10 Mm.
The colour of individual colonies was mapped onto the ITS phylogeny to assess whether colour could be used to distinguish species. The collection locations for zoanthid specimens included in the phylogenetic analyses were mapped on the resulting ITS phylogeny to assess the effect of geography on the estimation of species delimitations.
The geographic distributions of species were determined by compiling genetically verified species occurrence data from field collections, supplemented with occurrence data published in the sponge and zoanthid literature, and occurrence data transcribed from the labels of specimens in the Porifera and Cnidaria collections of the United States National Museum of Natural History (USNM).
PHYLOGENETIC RELATIONSHIPS AND THE
EVOLUTION OF HOST ASSOCIATIONS
The ITS phylogeny, constructed to analyse the delimitations of species, also reveals the evolutionary relationships between species, and is therefore useful in forming hypotheses about the the evolution of symbioses in zoanthids and the validity of current zoanthid systematics. The host species of individual zoanthids were mapped onto the ITS phylogeny to assess the effects of particular host associations on zoanthid species clade topology.
The 16S phylogeny was constructed to provide an independent assessment of the clades of species inferred in the ITS analysis. The host associations of zoanthid species (as defined by Pax & Müller, 1962; Herberts, 1972; West, 1979; Swain &Wulff, 2007) were mapped onto the ITS and 16S phylogenies to assess phylogenetic conservatism in the evolution of zoanthid–host associations, and also to detect host switches. The occurrence of zoanthid photoendosymbionts ( Symbiodinium ; as defined by West, 1979) was also mapped onto the ITS and 16S phylogenies to assess phylogenetic conservatism in the evolution of zoanthid– Symbiodinium associations, and to detect changes in zoanthid associations with Symbiodinium .
No known copyright restrictions apply. See Agosti, D., Egloff, W., 2009. Taxonomic information exchange and copyright: the Plazi approach. BMC Research Notes 2009, 2:53 for further explanation.