
Ornithischians
|
publication ID |
https://doi.org/ 10.7717/peerj.4417 |
|
DOI |
https://doi.org/10.5281/zenodo.5614763 |
|
persistent identifier |
https://treatment.plazi.org/id/03FE9007-FFB3-8307-FE21-FA1A7FB4D690 |
|
treatment provided by |
Plazi |
|
scientific name |
Ornithischians |
| status |
|
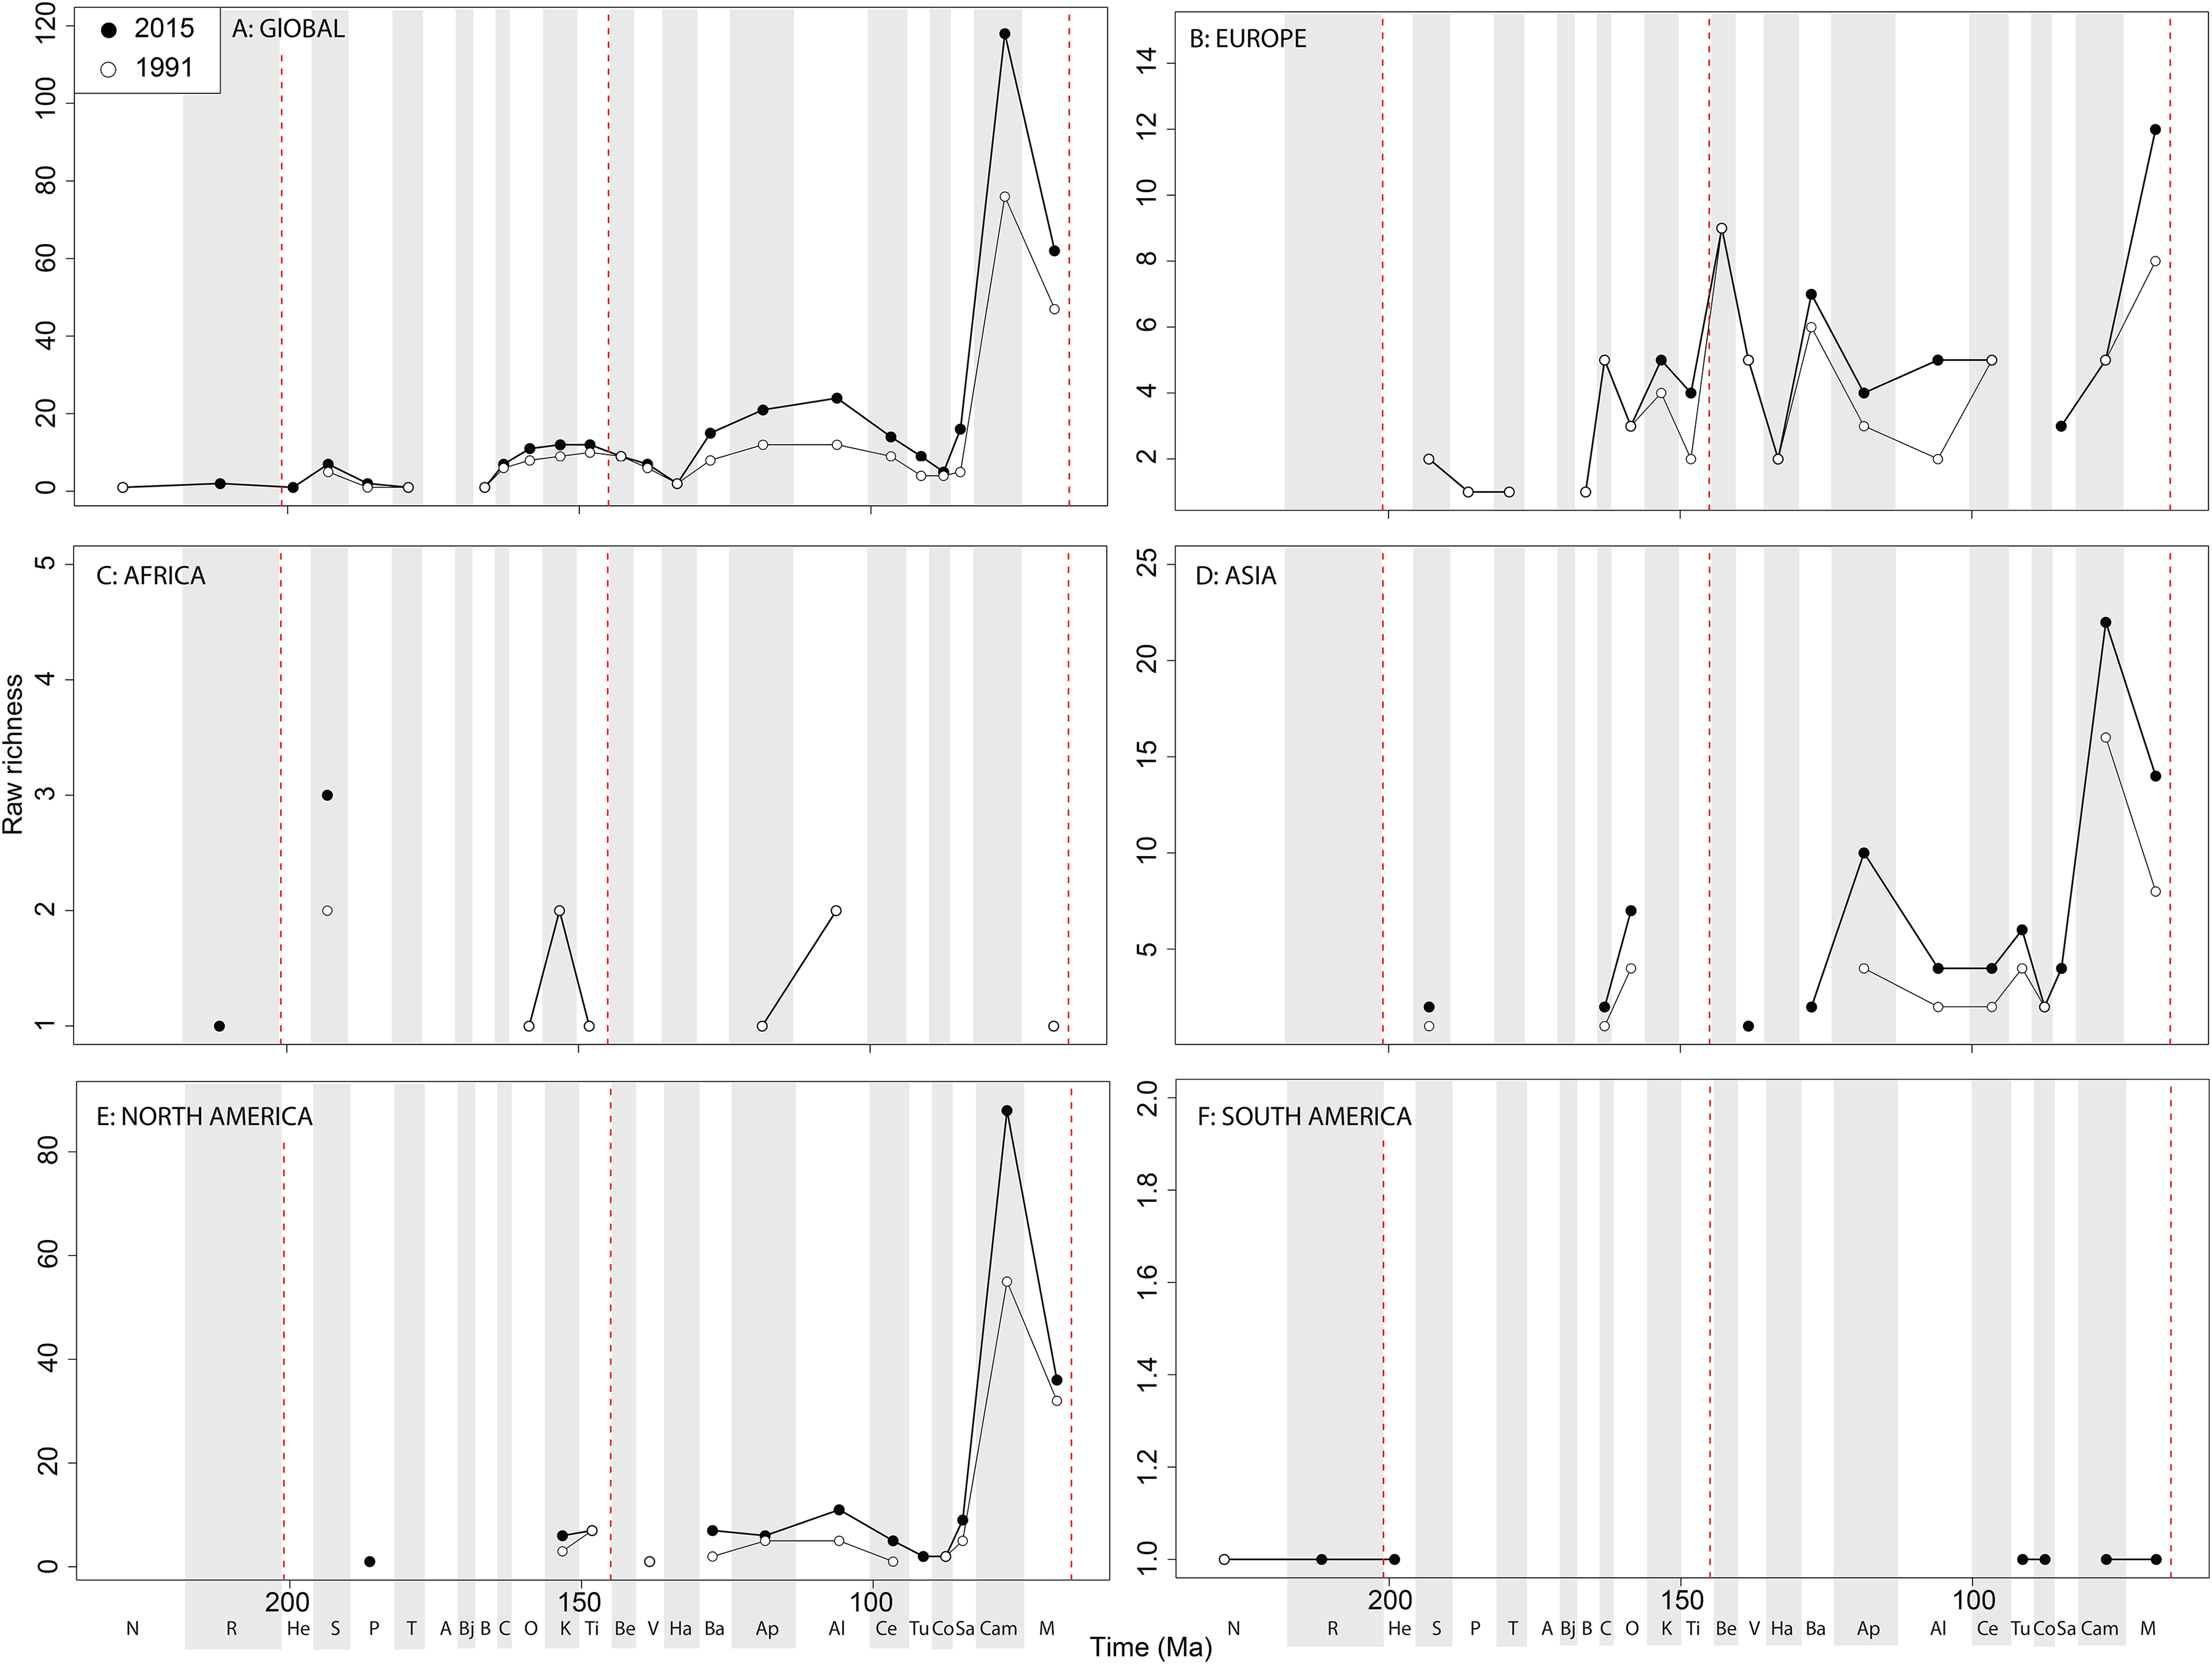
Raw ‘global’ ornithischian diversity ( Fig. 5A View Figure 5 ) is constant and stable throughout publication history. The apparent magnitude of longer-term trends is obscured by the relative over-sampling of the Campanian and Maastrichtian, which are almost an order of magnitude higher than any other Jurassic or Cretaceous stage interval. Indeed, the Campanian shows no sign of slowing down in increasing diversity, and is the highest and most rapidly increasing of any time interval. In spite of this, the overall trends in raw diversity remain, with steadily increasing Middle to Late Jurassic diversity, a small earliest Cretaceous decline followed by a ‘middle’ Cretaceous peak in the Aptian, a shallow decline into the early Late Cretaceous, and an increase in the Campanian.
Raw diversity in Europe shows increasing diversity across the J/K transition before an earliest Cretaceous decline (Valanginian–Hauterivian), constant ‘middle’ Cretaceous diversity, and an increase from the Campanian to Maastrichtian ( Fig. 5B View Figure 5 ). Raw African ornithischian diversity is too inconsistent to analyse any changes through geological time or publication time ( Fig. 5C View Figure 5 ). Raw Asian diversity is fairly constant through the Cretaceous, until an apparent major Campanian peak and Maastrichtian decline ( Fig. 5D View Figure 5 ). In North America, empirical diversity is flat and low throughout the Late Jurassic and most of the Cretaceous ( Fig. 5E View Figure 5 ). There is a Campanian peak, and order of magnitude higher than any prior interval, which is rapidly increasing through publication time.
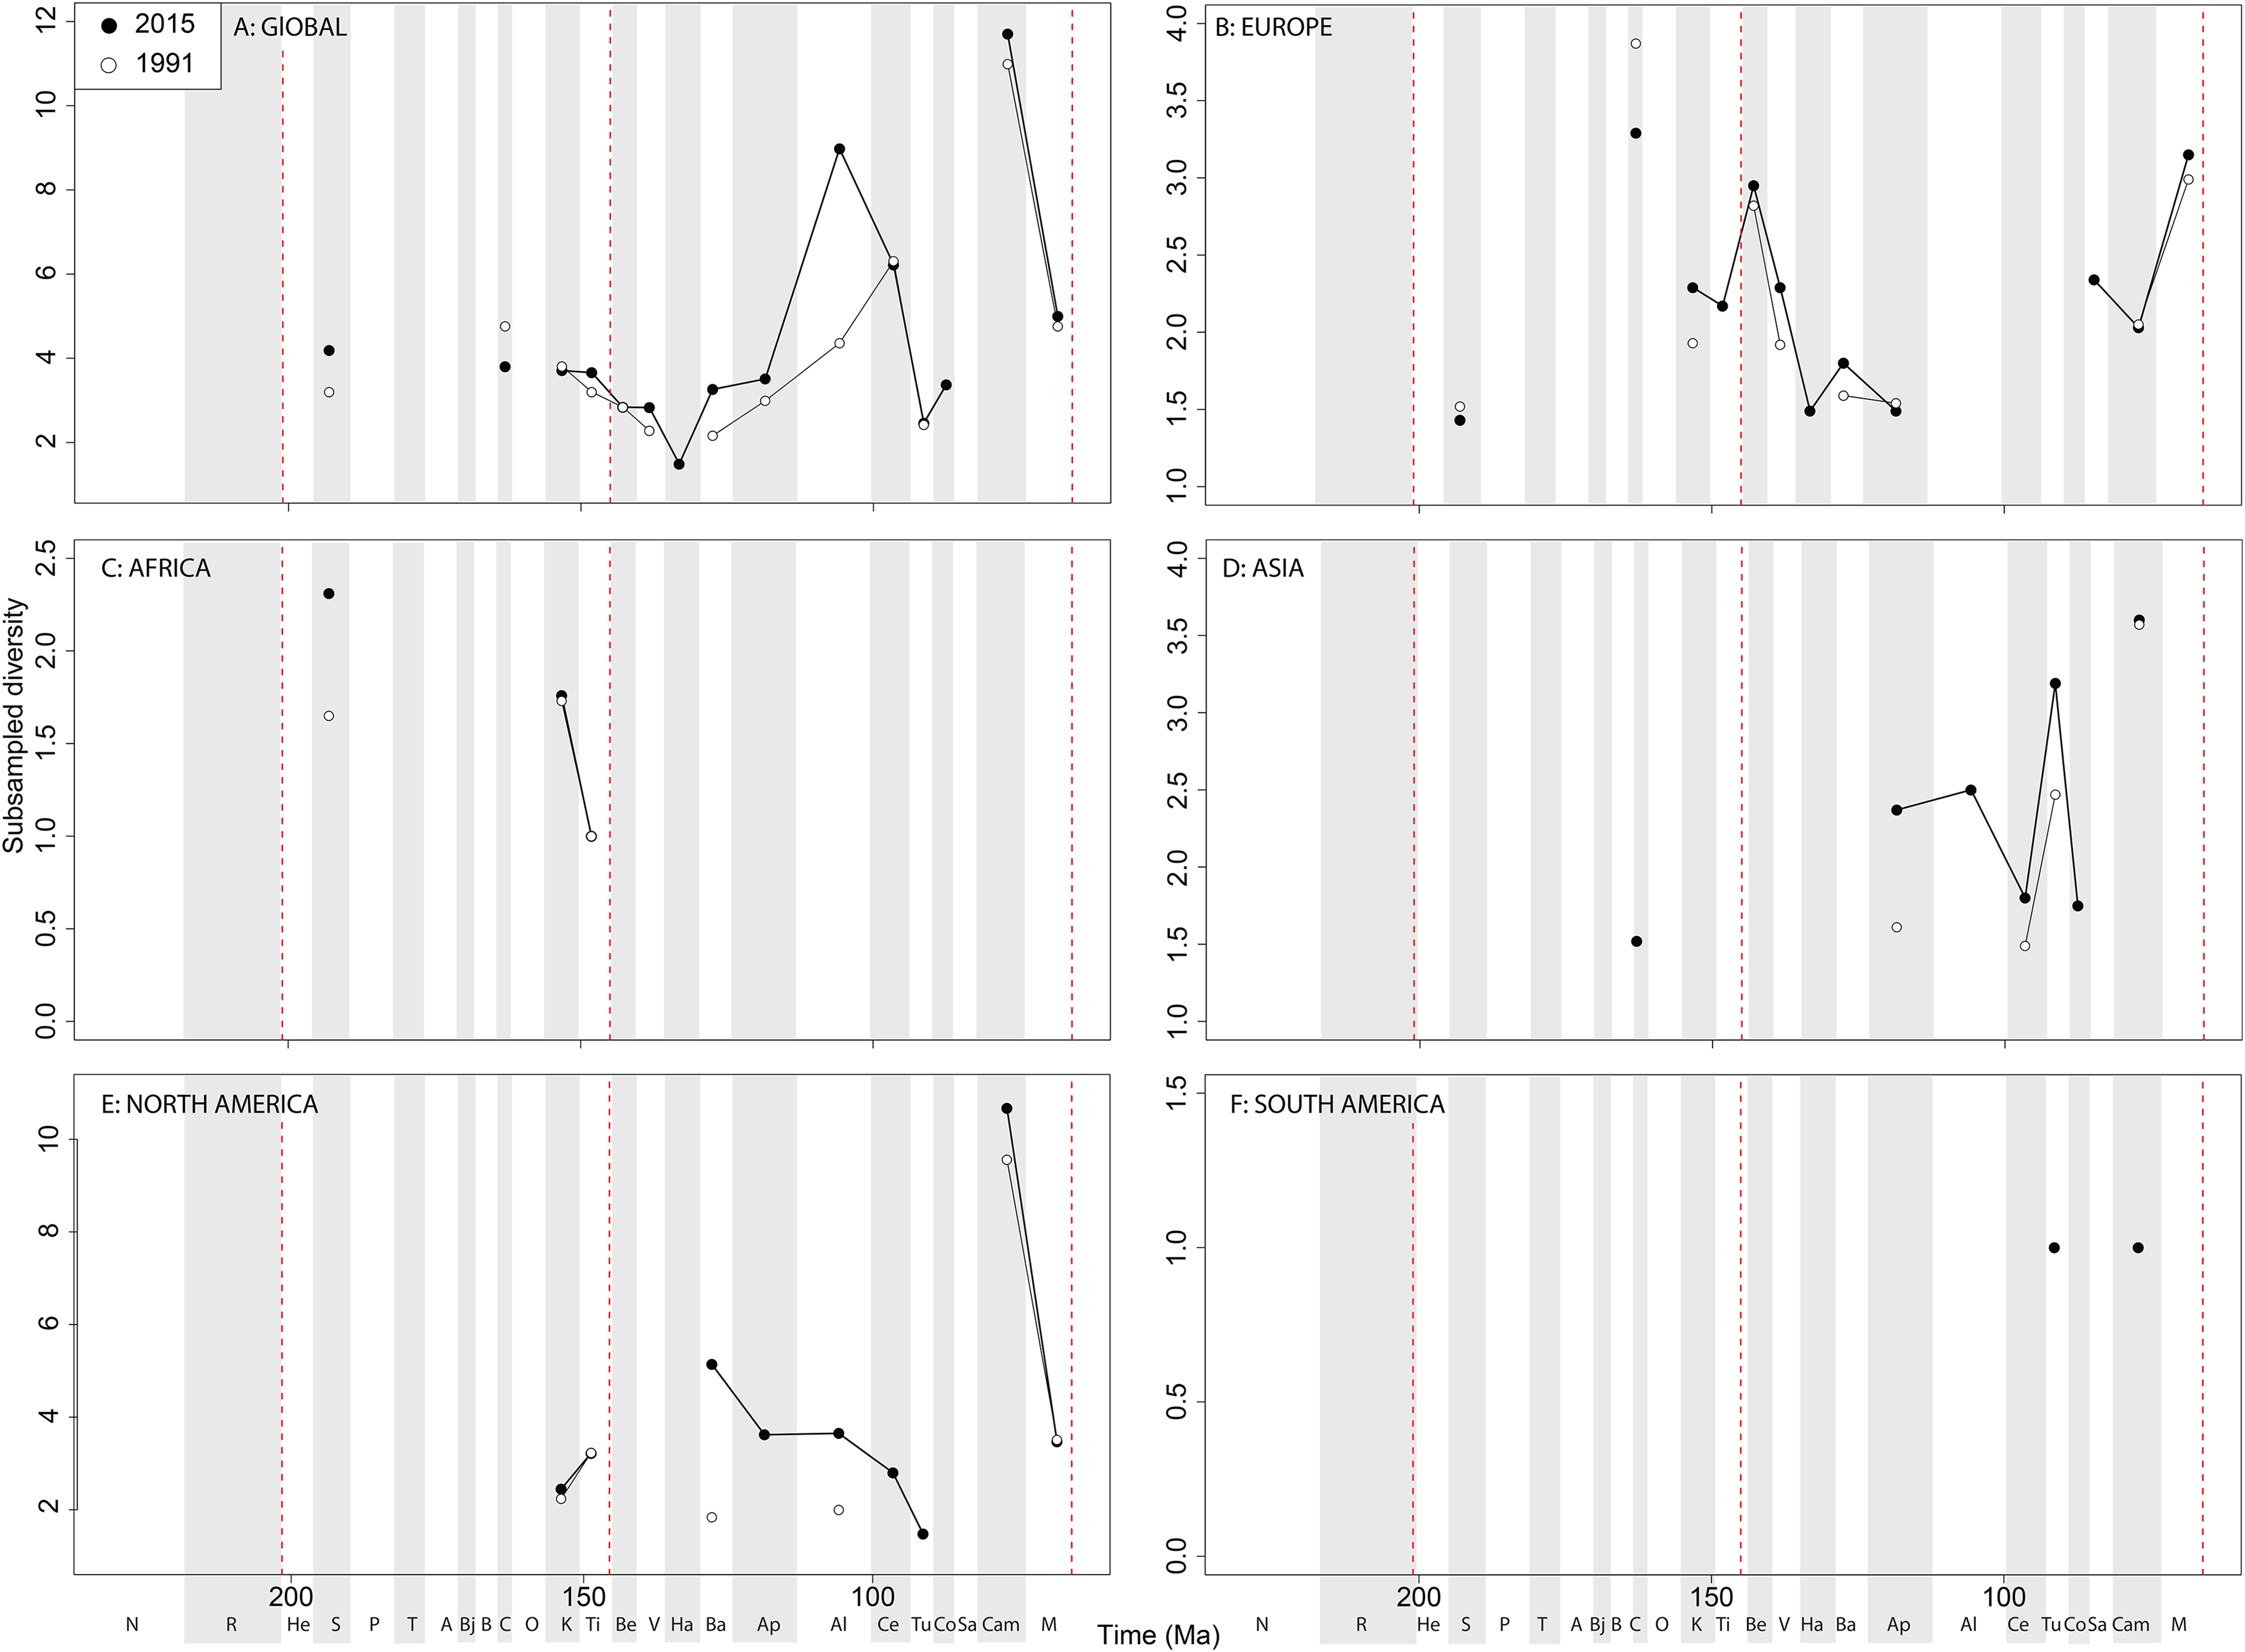
Diversity decreases from this into the Maastrichtian, in which diversity has remained relatively stable through publication time. Sampling in South America is also relatively poor, with apparent diversity remaining low and flat where a signal is obtained ( Fig. 5F View Figure 5 ). Subsampled ‘global’ ornithischian diversity shows a distinctly different pattern from the raw curve, both in terms of overall trends, and in terms of the magnitude of the effect of publication history ( Fig. 6A View Figure6 ). The Jurassic is generally too poorly sampled to reveal a constant signal, but there is evidence of a decline through the J/K transition, which remains constant through publication time. This is followed by a middle-Cretaceous increase, in which ornithischian diversity is at its second highest level throughout their history. The magnitude of this Albian radiation has rapidly increased over publication time, the result being that originally what appeared to be increasing subsampled diversity over the Early/Late Cretaceous transition now shows a major decline from the Albian to Coniacian. Santonian subsampled diversity remains unknown, but when we see a signal emerge in the Campanian, diversity is higher than the Albian, reaching its highest level before declining by more than half into the Maastrichtian. This overall structure, besides the Albian, remains consistent throughout publication time with no major perturbations to the apparent ‘global’ curve.
Subsampled European diversity reveals increasing diversity across the Tithonian/ Berriasian transition, followed by overall gradually decreasing diversity throughout the remainder of the Early Cretaceous ( Fig. 6B View Figure6 ). In Africa, the signal is too poor to reveal anything besides a Kimmeridgian/Tithonian subsampled diversity drop ( Fig. 6C View Figure6 ), and in Asia, there is evidence of a decline in subsampled diversity across the Albian/Cenomanian transition ( Fig. 6D View Figure6 ). In North America, subsampled diversity reveals a decline across the Early–Late Cretaceous transition, and a major decline from the Campanian to Maastrichtian, a pattern that remains stable through publication history ( Fig. 6E View Figure6 ). In South America, the subsampled signal is too poor to comment on ornithischian diversity ( Fig. 6F View Figure6 ).
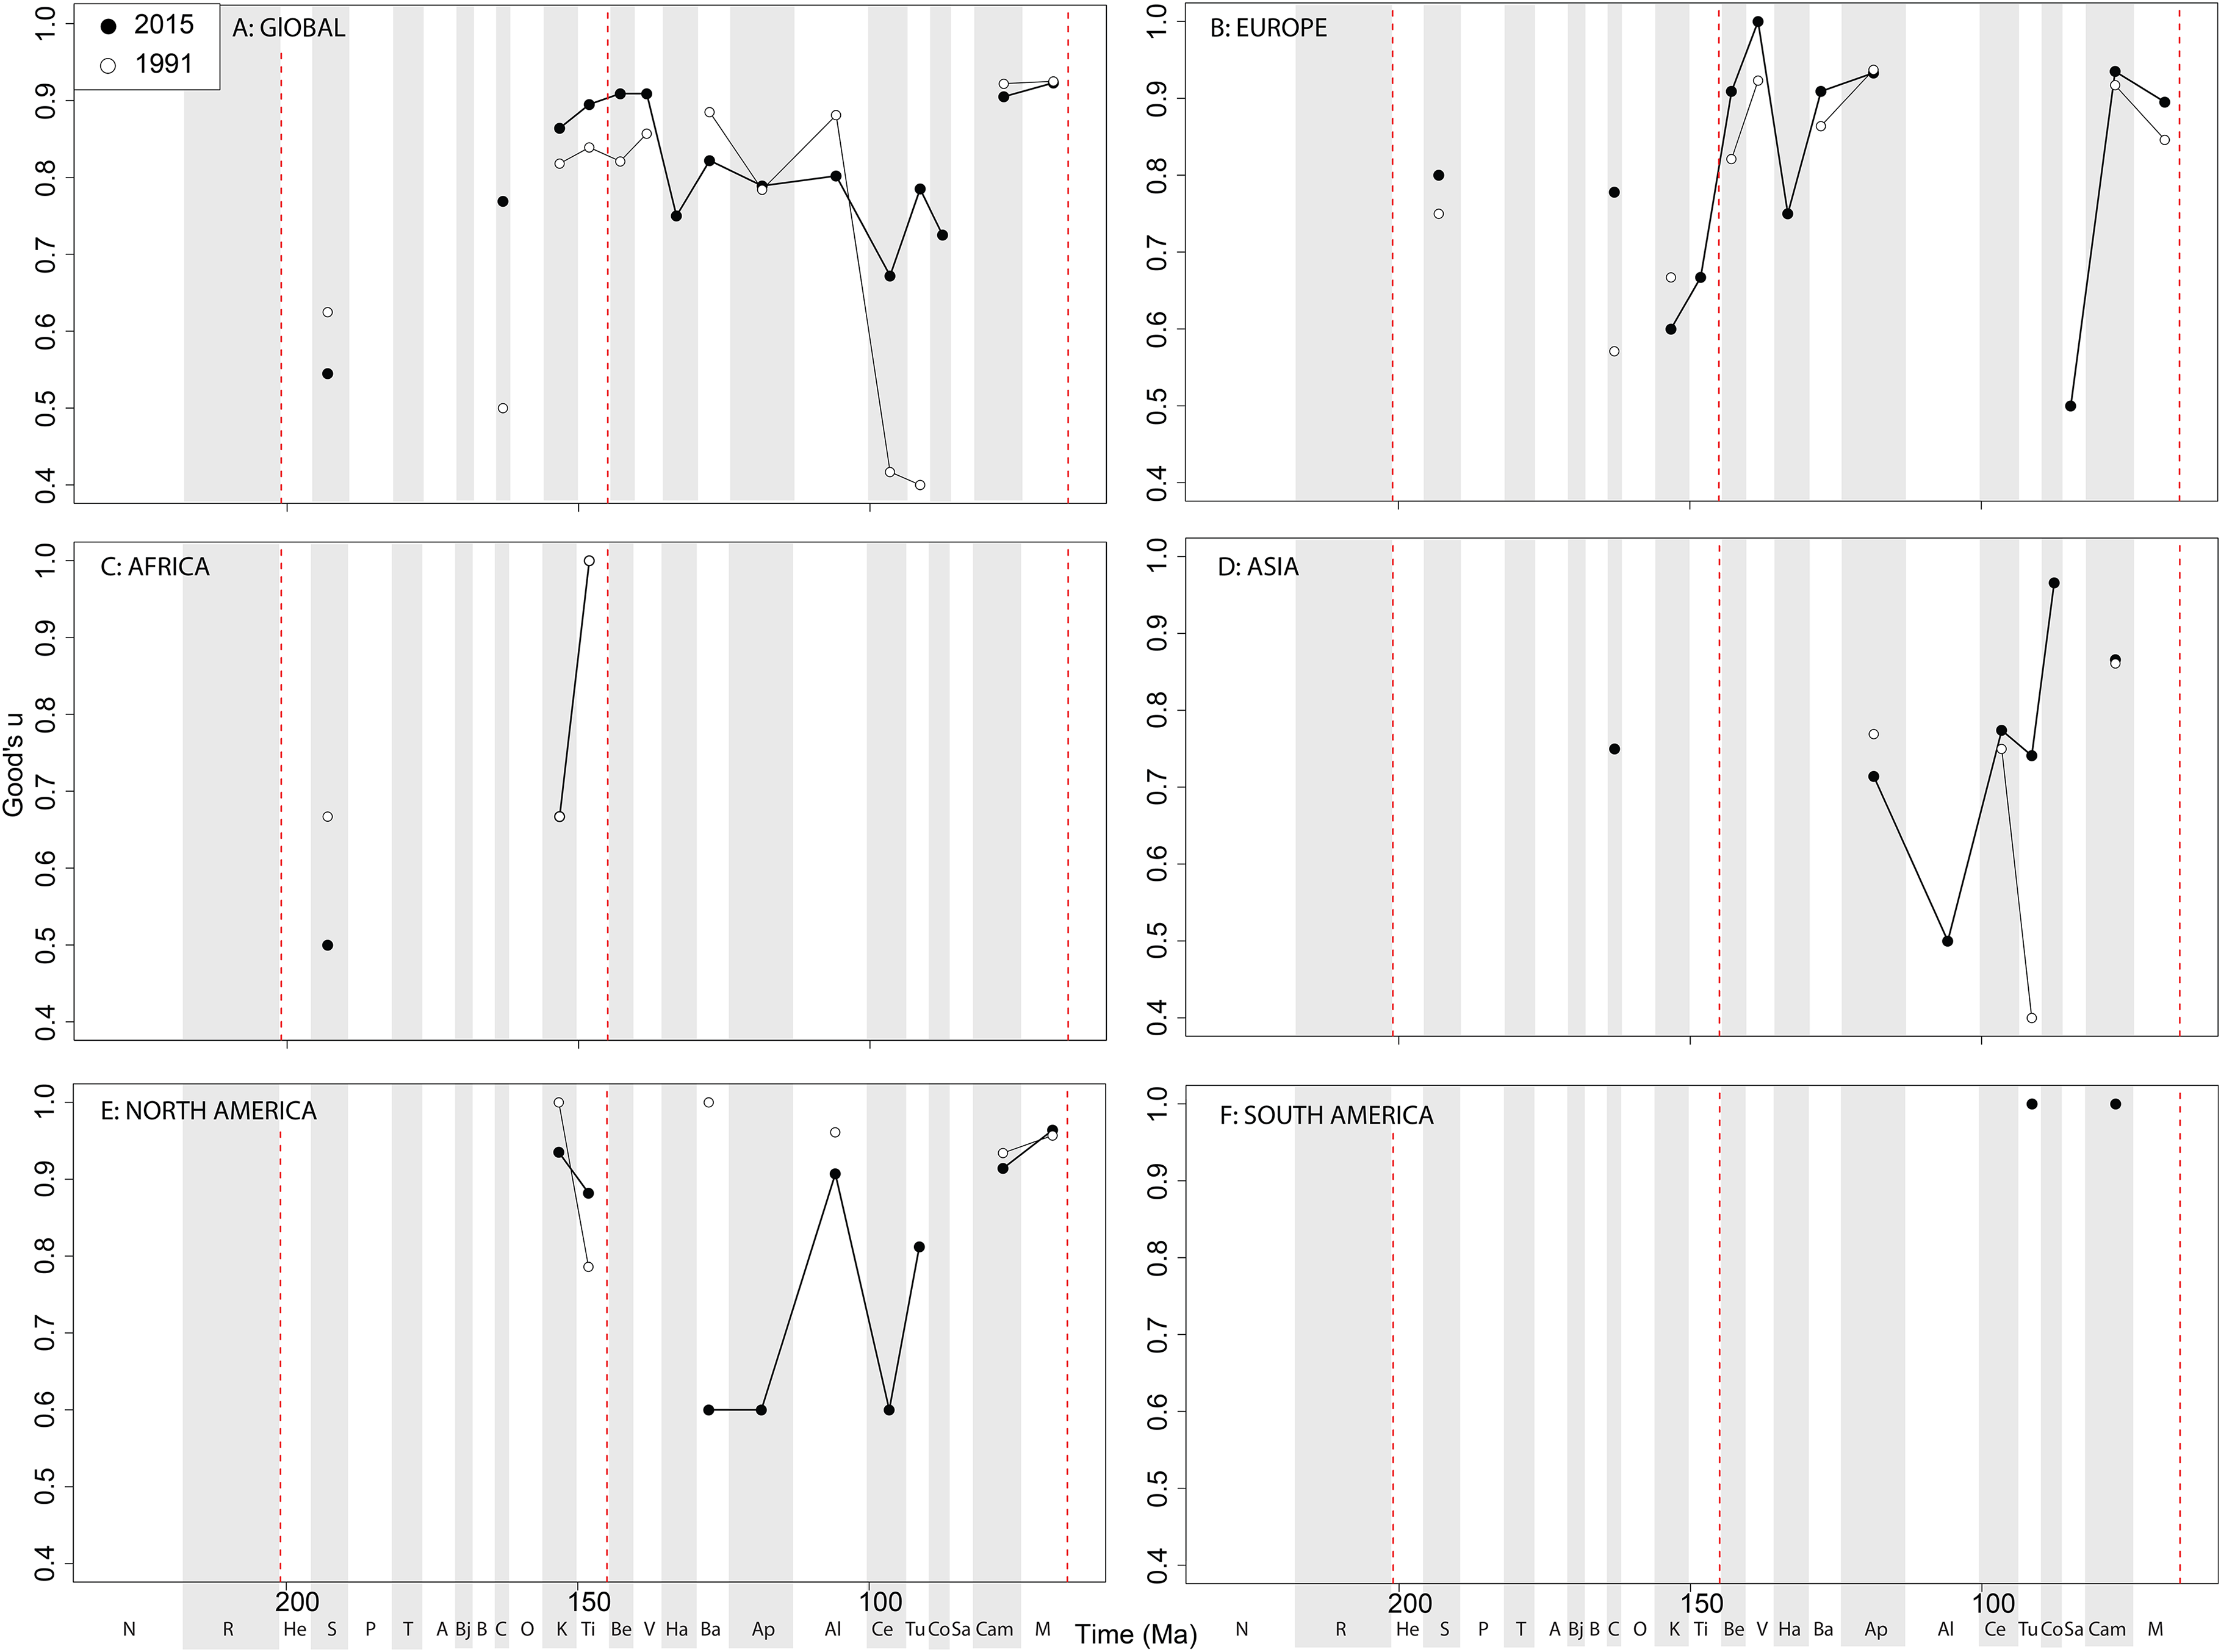
If we look at how coverage has changed through publication history (based on Good’s u), we should expect that subsampled diversity patterns are reflective of this pattern. At a global level, coverage in the Cretaceous is much better than the Jurassic ( Fig. 7A View Figure 7 ). Much of this, however, is based on patchy regional records. In Europe, we find that coverage increases across the J/K interval ( Fig. 7B View Figure 7 ), and is the only place where a consistently reliable record here can be obtained. In Africa, coverage is generally poor, besides in the latest Jurassic ( Fig. 7C View Figure 7 ). In Asia, coverage is poor up until the late Early Cretaceous ( Fig. 7D View Figure 7 ). In North America, coverage is good in the latest Jurassic and ‘middle’ to Late Cretaceous, but non-existent in Early to Middle Jurassic and earliest Cretaceous ( Fig. 7E View Figure 7 ). Coverage is generally poor for the entire South American ornithischian record ( Fig. 7F View Figure 7 ), explaining why obtaining a subsampled diversity signal here is difficult.
No known copyright restrictions apply. See Agosti, D., Egloff, W., 2009. Taxonomic information exchange and copyright: the Plazi approach. BMC Research Notes 2009, 2:53 for further explanation.