
Theropods
|
publication ID |
https://doi.org/ 10.7717/peerj.4417 |
|
DOI |
https://doi.org/10.5281/zenodo.5614765 |
|
persistent identifier |
https://treatment.plazi.org/id/03FE9007-FFB4-831A-FE21-FA3A7F76D7F5 |
|
treatment provided by |
Plazi |
|
scientific name |
Theropods |
| status |
|
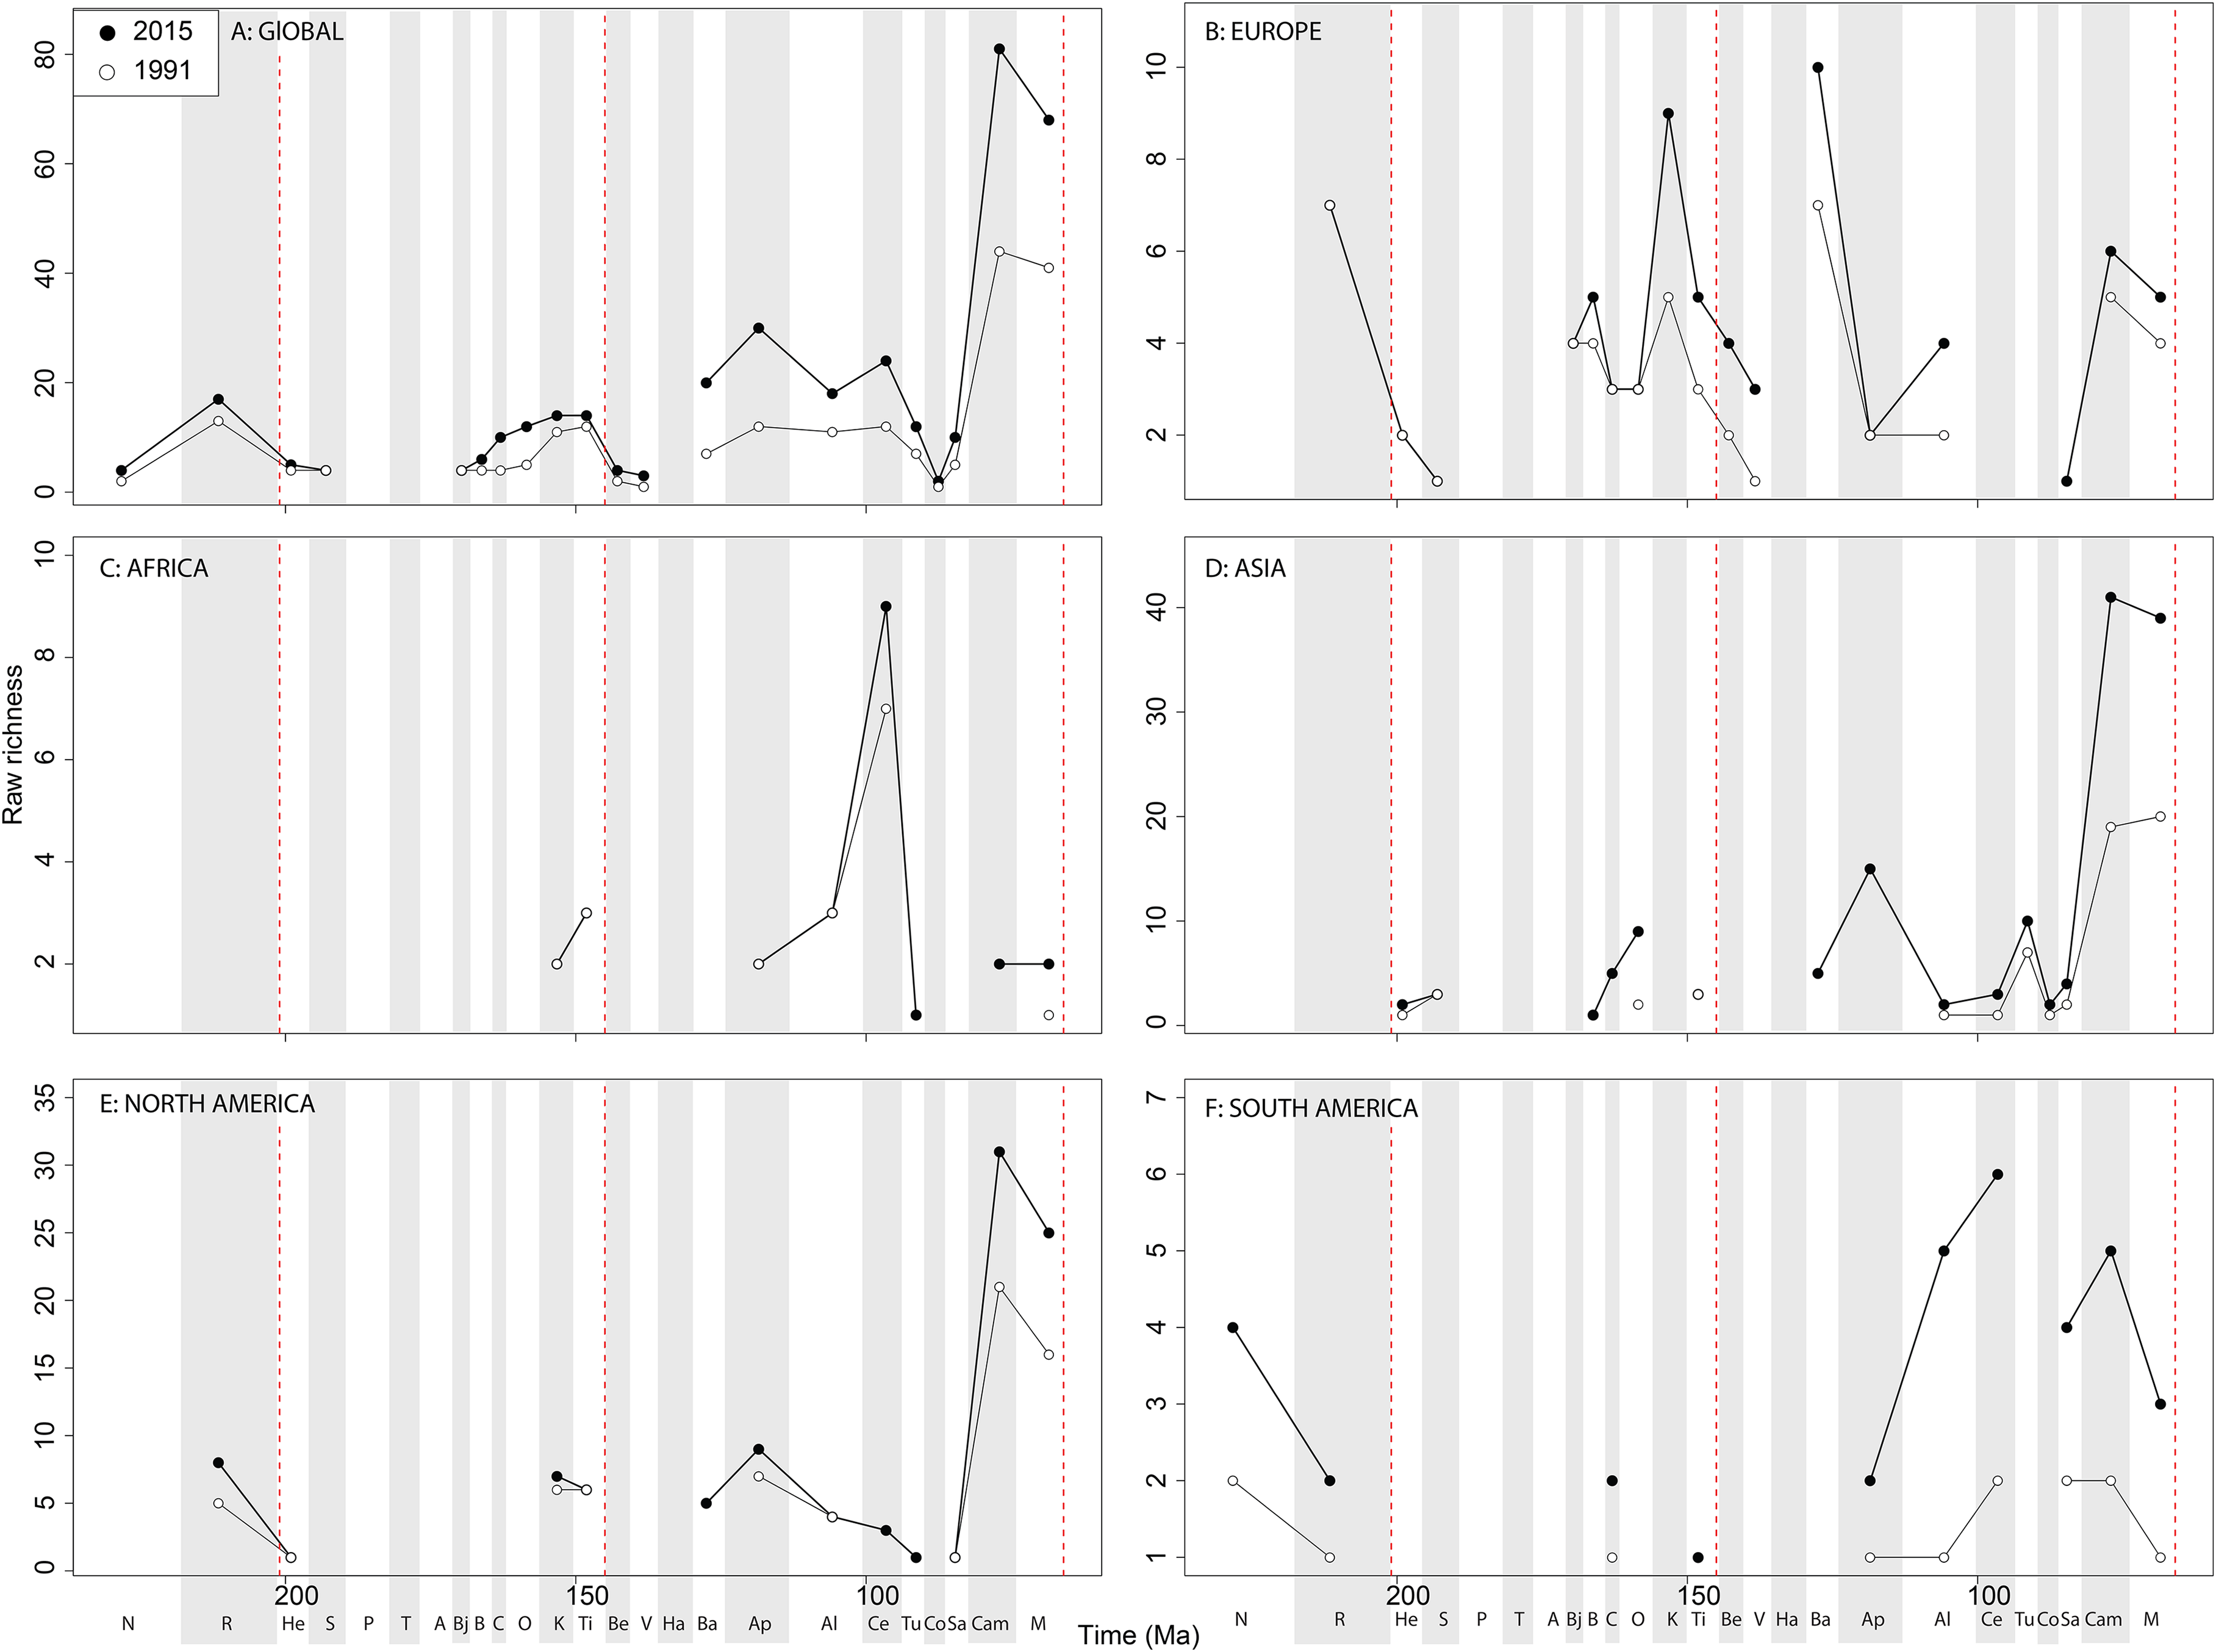
The overall shape of the raw ‘global’ theropod diversity curve remains consistent through publication history for the Jurassic ( Fig. 8A View Figure 8 ), similar to ornithischians, where we see steadily increasing Middle–Late Jurassic diversity. ‘Middle’ Cretaceous raw diversity fluctuated, followed by a major Campanian–Maastrichtian rise. The lowest apparent diversity is in the Coniacian, reaching earliest Cretaceous levels. Notable variations due to publication history are in the Barremian–Cenomanian, where diversity increases in magnitude through time, gradually exceeding that for Late Jurassic diversity. Raw European diversity is fairly constant through publication history ( Fig. 8B View Figure 8 ), with a Middle Jurassic diversity peak in the Bathonian, followed by a Callovian–Oxfordian trough, a second larger Kimmeridgian peak, and then constant decline from the Tithonian to the Valanginian. Barremian diversity is increases through publication time, and is as high as Kimmeridgian levels. Aptian and Albian diversity is relatively low through publication history. Campanian and Maastrichtian diversity levels are slowly increasing through publication history. As with ornithischians, African theropods are generally too poorly sampled at the stage level to recognise any consistent empirical patterns ( Fig. 8C View Figure 8 ). There is a Cenomanian raw diversity spike, but how this compares with much of the rest of the Cretaceous is obscured by patchy sampling. In Asia, raw Late Jurassic diversity is generally lower than for the Cretaceous ( Fig. 8D View Figure 8 ). The Cretaceous sees three peaks in apparent diversity during the Aptian, Turonian, and Campanian–Maastrichtian, with the latter being considerably higher than any previous one, and growing rapidly through publication history. In North America, raw diversity levels are dwarfed by the intensive sampling of latest Cretaceous theropods, with major gaps in the Middle–Late Jurassic and earliest Cretaceous records ( Fig. 8E View Figure 8 ). Campanian and Maastrichtian raw diversity is constantly increasing at a faster rate than any other time interval, and consistently reveals a slight apparent diversity decline into the end-Cretaceous. Raw South American diversity estimates are changing rapidly through publication history, with almost every interval in which dinosaurs are available to be sampled doubling or tripling since 1991 ( Fig. 8F View Figure 8 ). Of note is a recently emerging Late Jurassic theropod fossil record in South America, which at the present reveals an apparent low diversity.
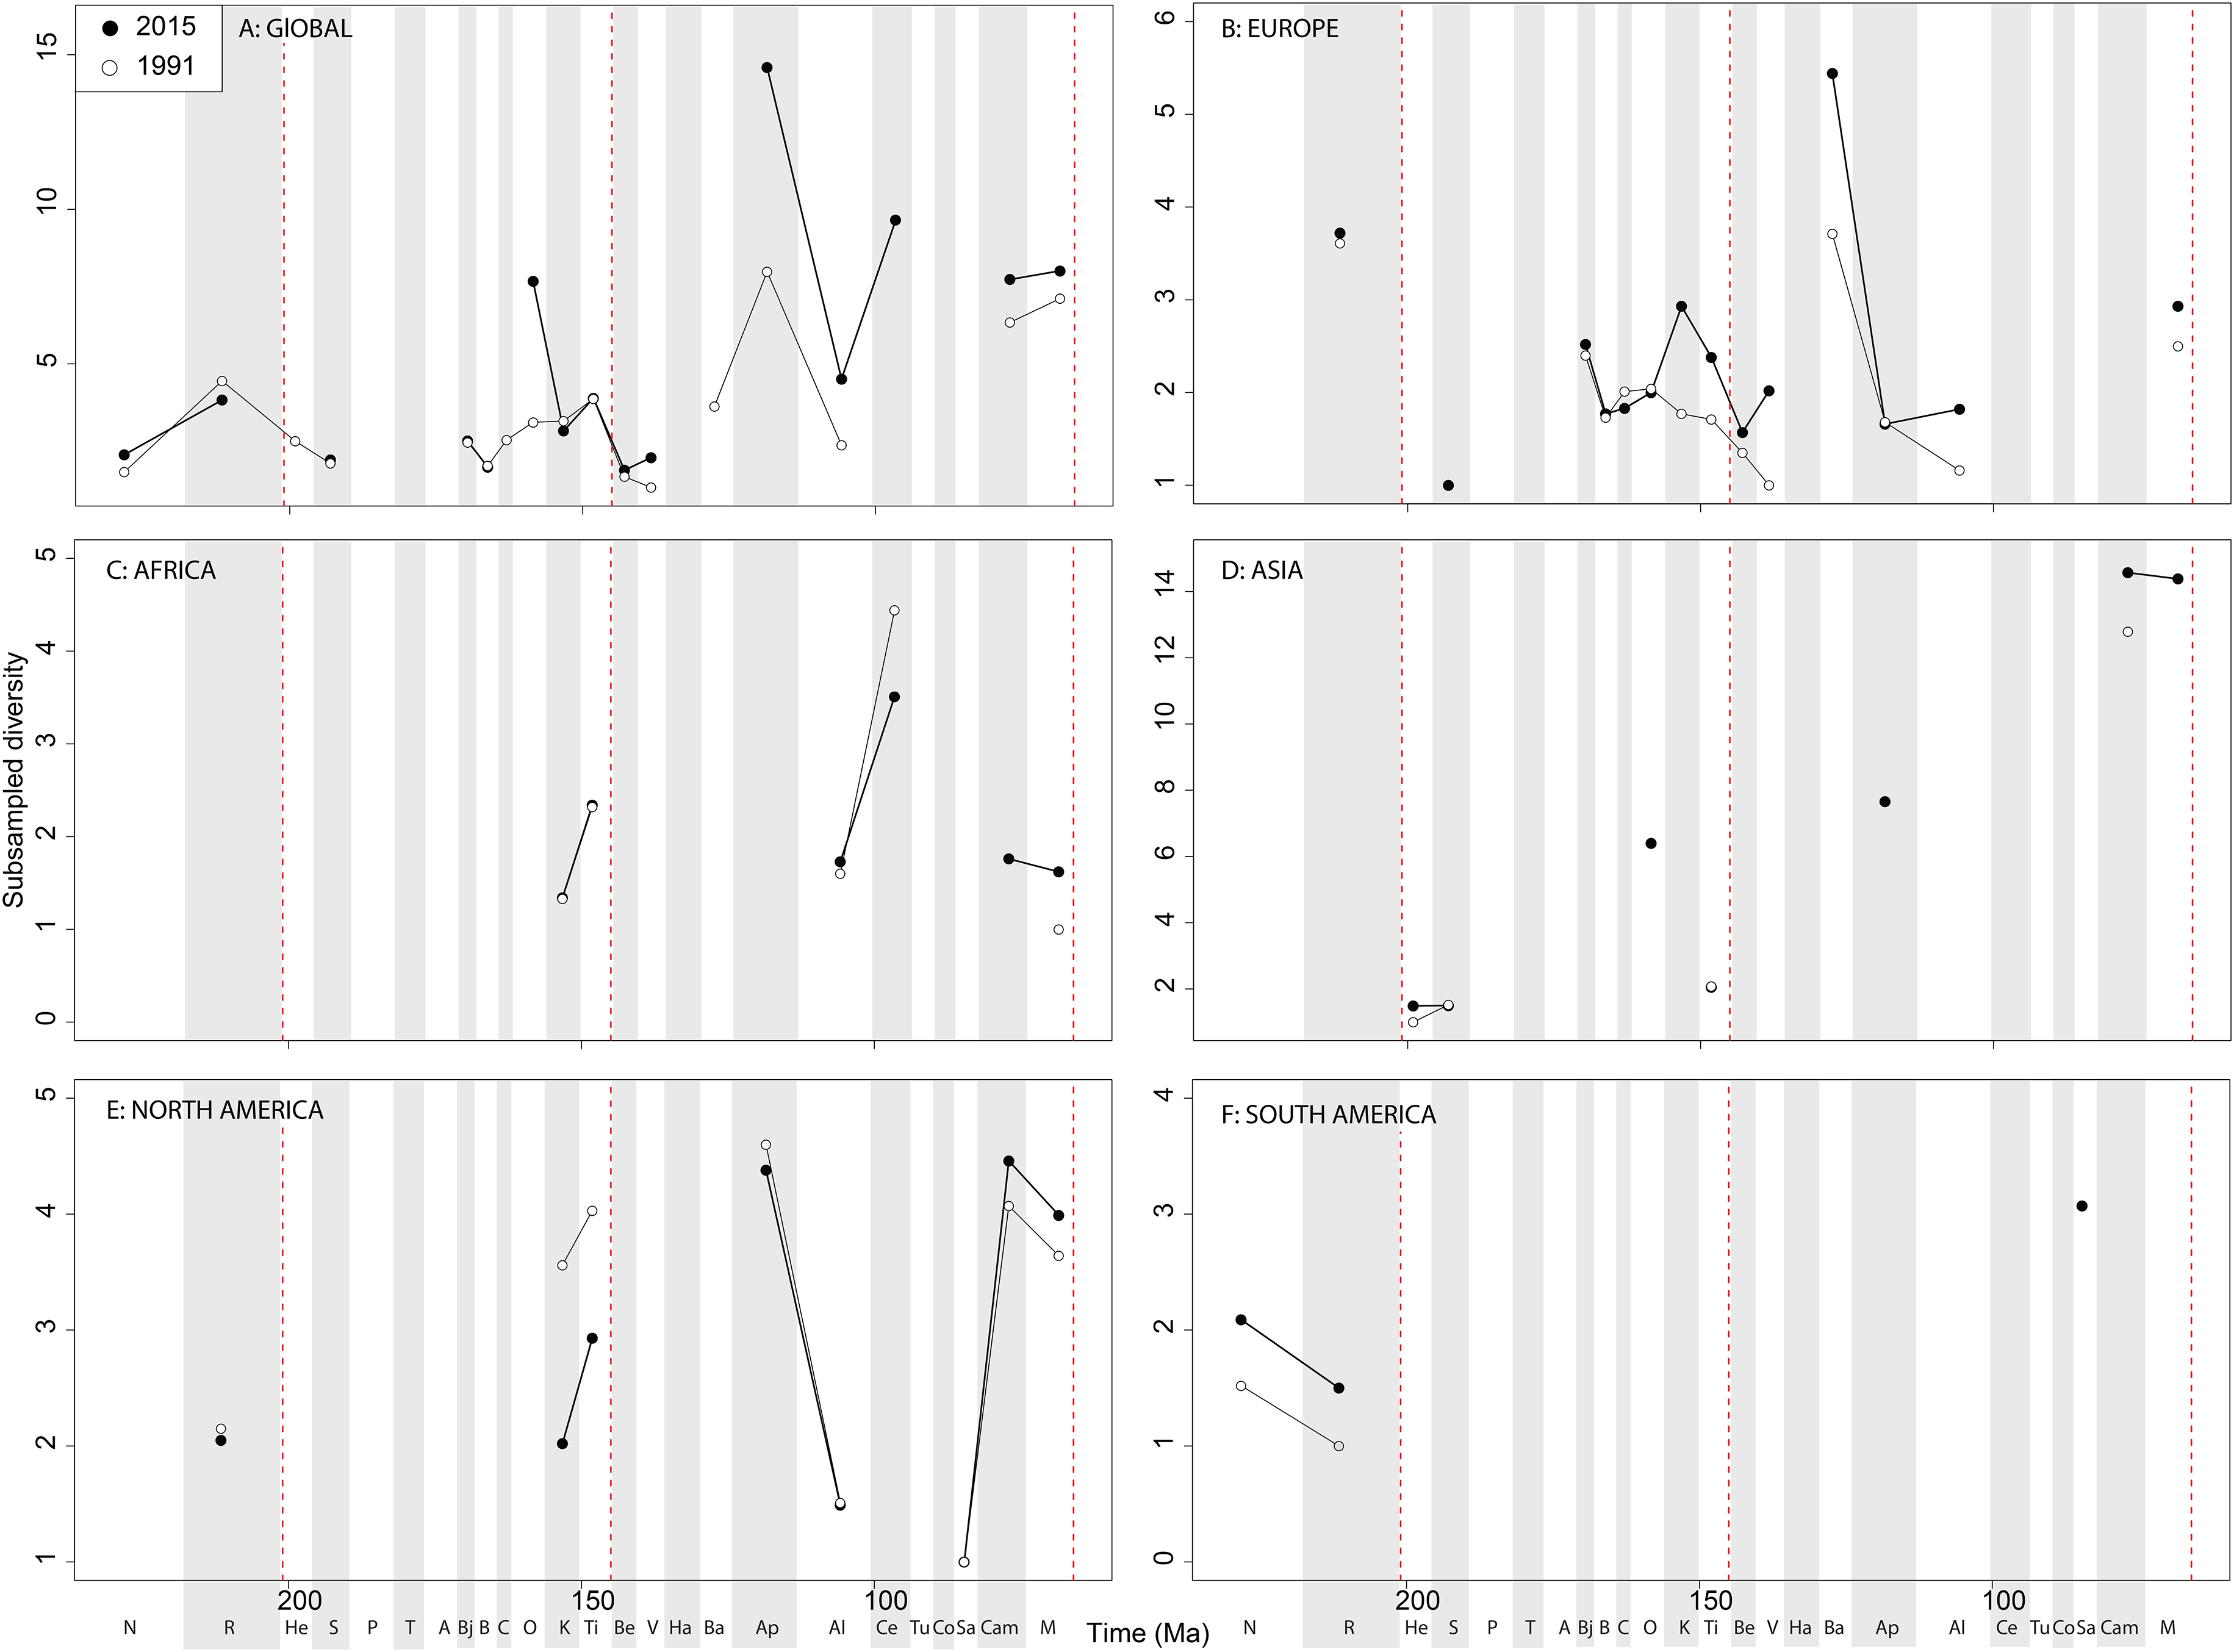
When subsampling is applied, in the Late Jurassic we see a switch from steadily increasing subsampled diversity to a major Oxfordian peak and subsequent decline in diversity through the J/K transition decline, a pattern that is consistently recovered through publication time ( Fig. 9A View Figure 9 ). Subsampled diversity is at its highest level during the Aptian than at any other stage during theropod history, and has doubled in the last 20 years of publication history. Campanian and Maastrichtian diversity are as high as the Cenomanian, a pattern that remains consistent through publication time. We see the ‘global’ J/K transition decline reflected in Europe ( Fig. 9B View Figure 9 ), and a strong Barremian peak, which is not captured on a ‘global’ scale. Latest Triassic subsampled diversity is higher than at any other point in the Jurassic in Europe. Maastrichtian subsampled diversity remains high, reaching the same level as that for the Kimmeridgian. In Africa, as with ornithischians the signal is very patchy after subsampling is applied ( Fig. 9C View Figure 9 ), but captures an Albian–Cenomanian diversity increase, which remains constant throughout publication history, and flat diversity in the latest Cretaceous. The subsampled theropod diversity signal is also patchy in Asia, but does reveal a very high latest Cretaceous diversity level, which is not otherwise seen throughout theropod evolutionary history ( Fig. 9D View Figure 9 ). In North America, the subsampled record is as patchy as that for ornithischians, but remains stable through publication history ( Fig. 9E View Figure 9 ). Here, we see slightly increasing subsampled diversity in the latest Jurassic, a large decline from the Aptian to Albian, and a major diversification from the Santonian to Campanian. In South America, a subsampled diversity signal is almost entirely absent, although we do see a reduction in almost half from the Norian to Rhaetian, which remains stable through publication history ( Fig. 9F View Figure 9 ).
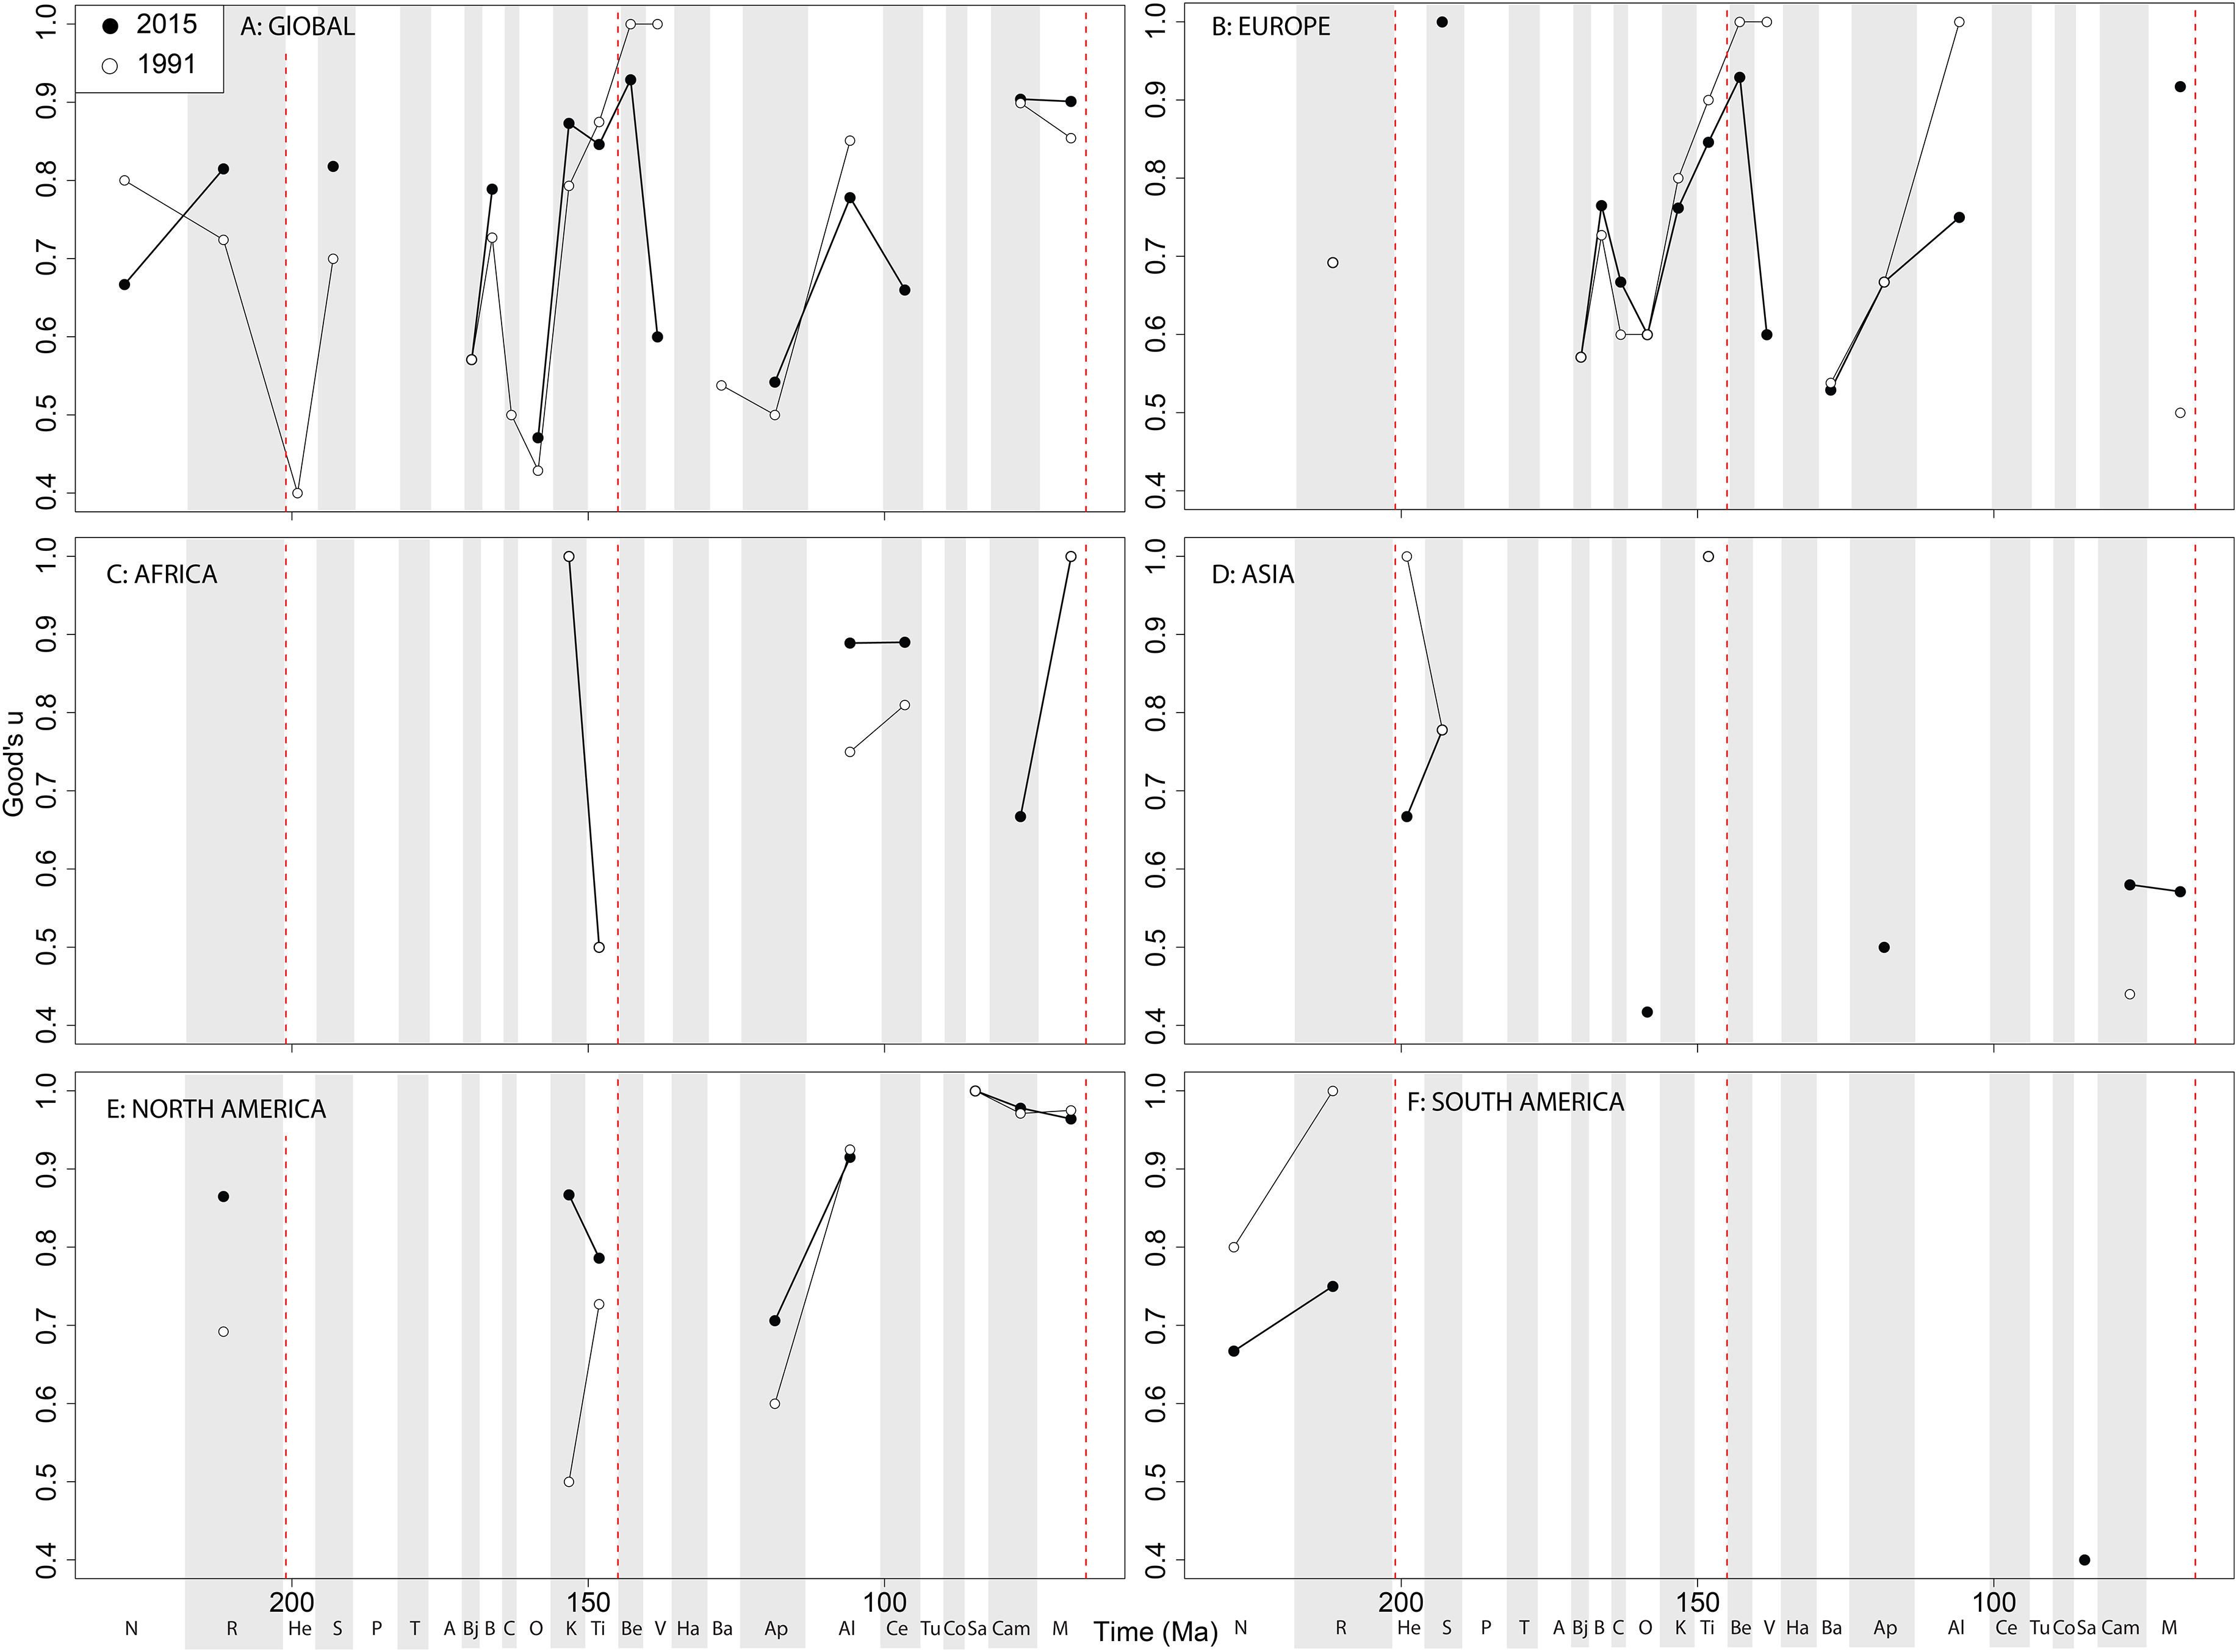
Theropod coverage levels are quite patchy at the ‘global’ level, remaining constant in the Late Triassic, fluctuating in the Middle Jurassic to earliest Cretaceous, but remaining fairly stable in the ‘middle’ and latest Cretaceous through publication history ( Fig. 10A View Figure 10 ). On a regional level, this apparent ‘global’ signal across the J/K transition is again emphasised in Europe, but in the Valanginian and Albian, coverage is getting notably worse through publication history ( Fig. 10B View Figure 10 ). Coverage in Africa ( Fig. 10C View Figure 10 ) and Asia ( Fig. 10D View Figure 10 ) is very patchy, and does not appear to have changed in the last 20 years overall, besides the origin of moderate coverage levels in the Oxfordian and Aptian of Asia. In North America, coverage levels are moderately high in the latest Jurassic, Aptian, and Albian, and latest Cretaceous, only improving in the latest Jurassic through publication history ( Fig. 10E View Figure 10 ). In South America, coverage is generally poor throughout the Jurassic and Cretaceous, but appears to be declining in the Norian and Rhaetian theropod records ( Fig. 10F View Figure 10 ).
No known copyright restrictions apply. See Agosti, D., Egloff, W., 2009. Taxonomic information exchange and copyright: the Plazi approach. BMC Research Notes 2009, 2:53 for further explanation.