
Alnus
|
publication ID |
https://doi.org/10.1016/j.phytochem.2020.112292 |
|
DOI |
https://doi.org/10.5281/zenodo.8305093 |
|
persistent identifier |
https://treatment.plazi.org/id/4E6E87B6-FFC4-B919-FFC1-78B2FC34E555 |
|
treatment provided by |
Felipe |
|
scientific name |
Alnus |
| status |
|
2.1. MS/MS analysis and annotation of Alnus specialized metabolites
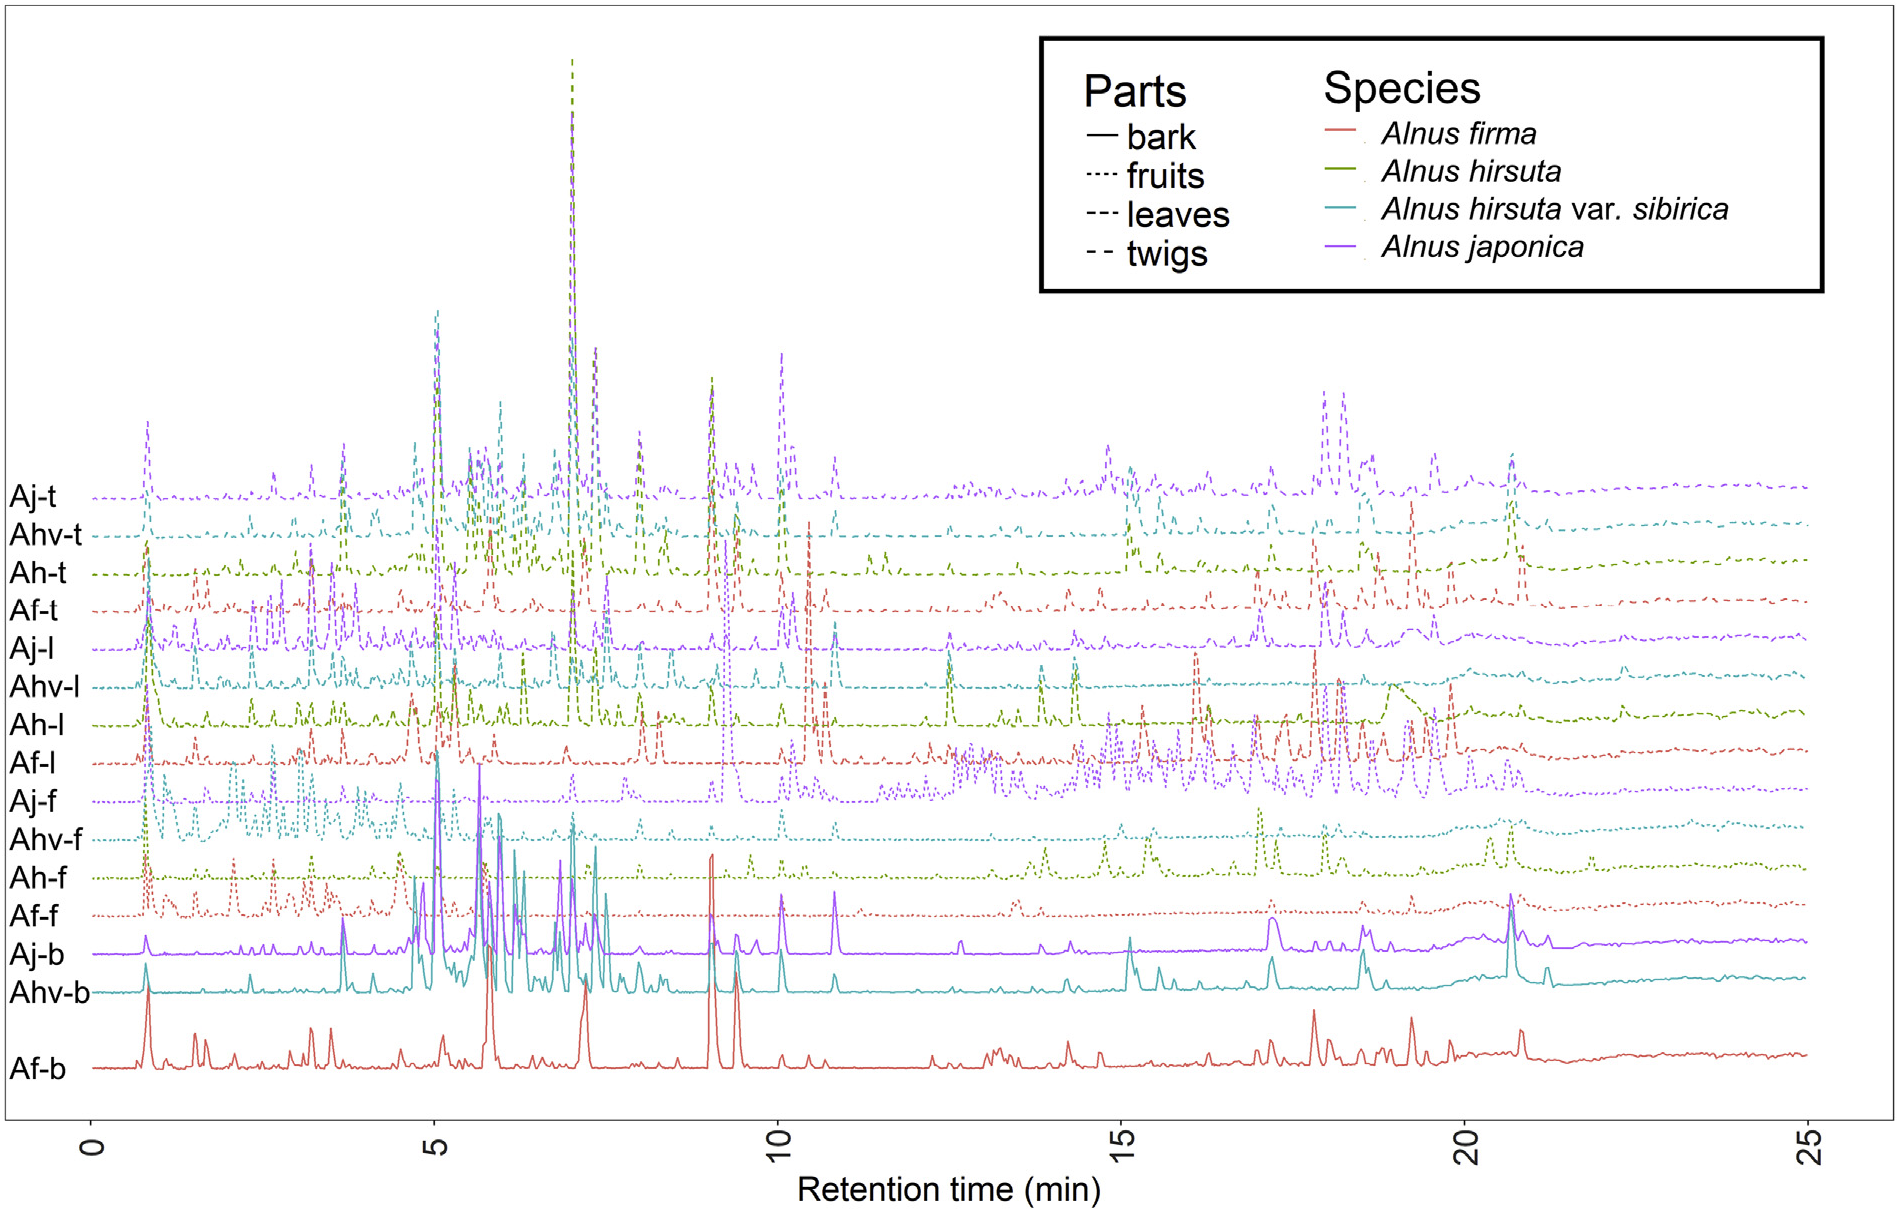
The LC –MS/MS analysis revealed that the 15 Alnus extracts are different in their specialized metabolite contents, in both a qualitative and quantitative manner ( Fig. 1 View Fig ). As a first step of the digitized data analysis, 531 mass features were extracted from the entire dataset by MZmine2-based preprocessing, then the feature table, metadata, and extracted MS/MS spectral.mgf files were uploaded to the GNPS MS/MS molecular networking workflow (Nothias et al., 2019). MS/MS molecular networking organized them into a network consisting of 33 molecular families (two or more connected nodes of a graph ( Nguyen et al., 2013)) and 268 singletons (nodes not having any molecular relatives). Two types of metadata related to spectral sources, plant species and plant parts, were visualized upon the molecular network. Both species-mapping ( Fig. S1 View Fig , Supplementary Data) and plant parts-mapping ( Fig. 2 View Fig ) visualized that many metabolites in certain molecular families are constrained to specific species plant parts. For example, spectral nodes in molecular family B are mainly found in fruits, while other metabolites in molecular family D are from bark and twigs and spectra in molecular family E are predominantly observed in leaves. Metabolites in molecular family F was only found in A. firma . The largest molecular family, A, could be divided into two subclusters based on distribution ( Fig. 2 View Fig ). This finding reveals the localization of closely related yet different chemical structures in different plant parts.
The MS/MS spectral library search through GNPS resulted in 47 hits to reference MS/MS spectra, which are level 2 annotations according to the 2007 Metabolomics Standards Initiative (MSI) ( Sumner et al., 2007). Nine previously isolated and purified diarylheptanoids, platyphylloside ( 1; numbers mean spectra indices in the MS/MS molecular network), aceroside VII ( 63), aceroside VIII ( 195), oregonin ( 202), rubranoside B ( 206), rubranoside A ( 214), rubranoside D ( 240), (5 S)– O -methylhirstanonol ( 241), and oregonoyl A ( 246) were used to confirm annotations and give level 1 annotations by matching retention time and MS/MS spectra ( Lee et al., 2013, 2010; Sung and Lee, 2015). Retention time and spectra of these compounds can be found in Result S1, Supplementary Data.
To maximize the annotation coverage upon the entire dataset, we applied MolNetEnhancer, a recently developed computational workflow for MS/MS-based untargeted metabolomics (Ernst et al., 2019a). Based on the GNPS library matching and in silico annotation derived from Network Annotation Propagation (NAP) ( da Silva et al., 2018), most of the molecular families could be annotated for their unique chemical classes, which are MSI level 3 annotations. Computational class annotations made by MolNetEnhancer was double-checked manually in order to prevent false annotations. Most in silico predicted annotations were reasonable, but some molecular families showed incorrect annotations. For example, the whole molecular family A was annotated as triterpenoids by MolNetEnhancer, but manual inspection on molecular annotations of each spectral node suggested that two subclusters within A should be annotated as diarylheptanoids and triterpenoids, respectively ( Fig. S2 View Fig , Supplementary Data). Within the molecular network, class annotation elucidated the localization patterns of different classes. For example, molecular families A, D, and I, which are present in bark and twigs, were annotated as diarylheptanoids and their glycosides. Fruits of Alnus species showed high contents of ellagitannins ( B), while the leaves were abundant in flavonoid glycosides ( E).
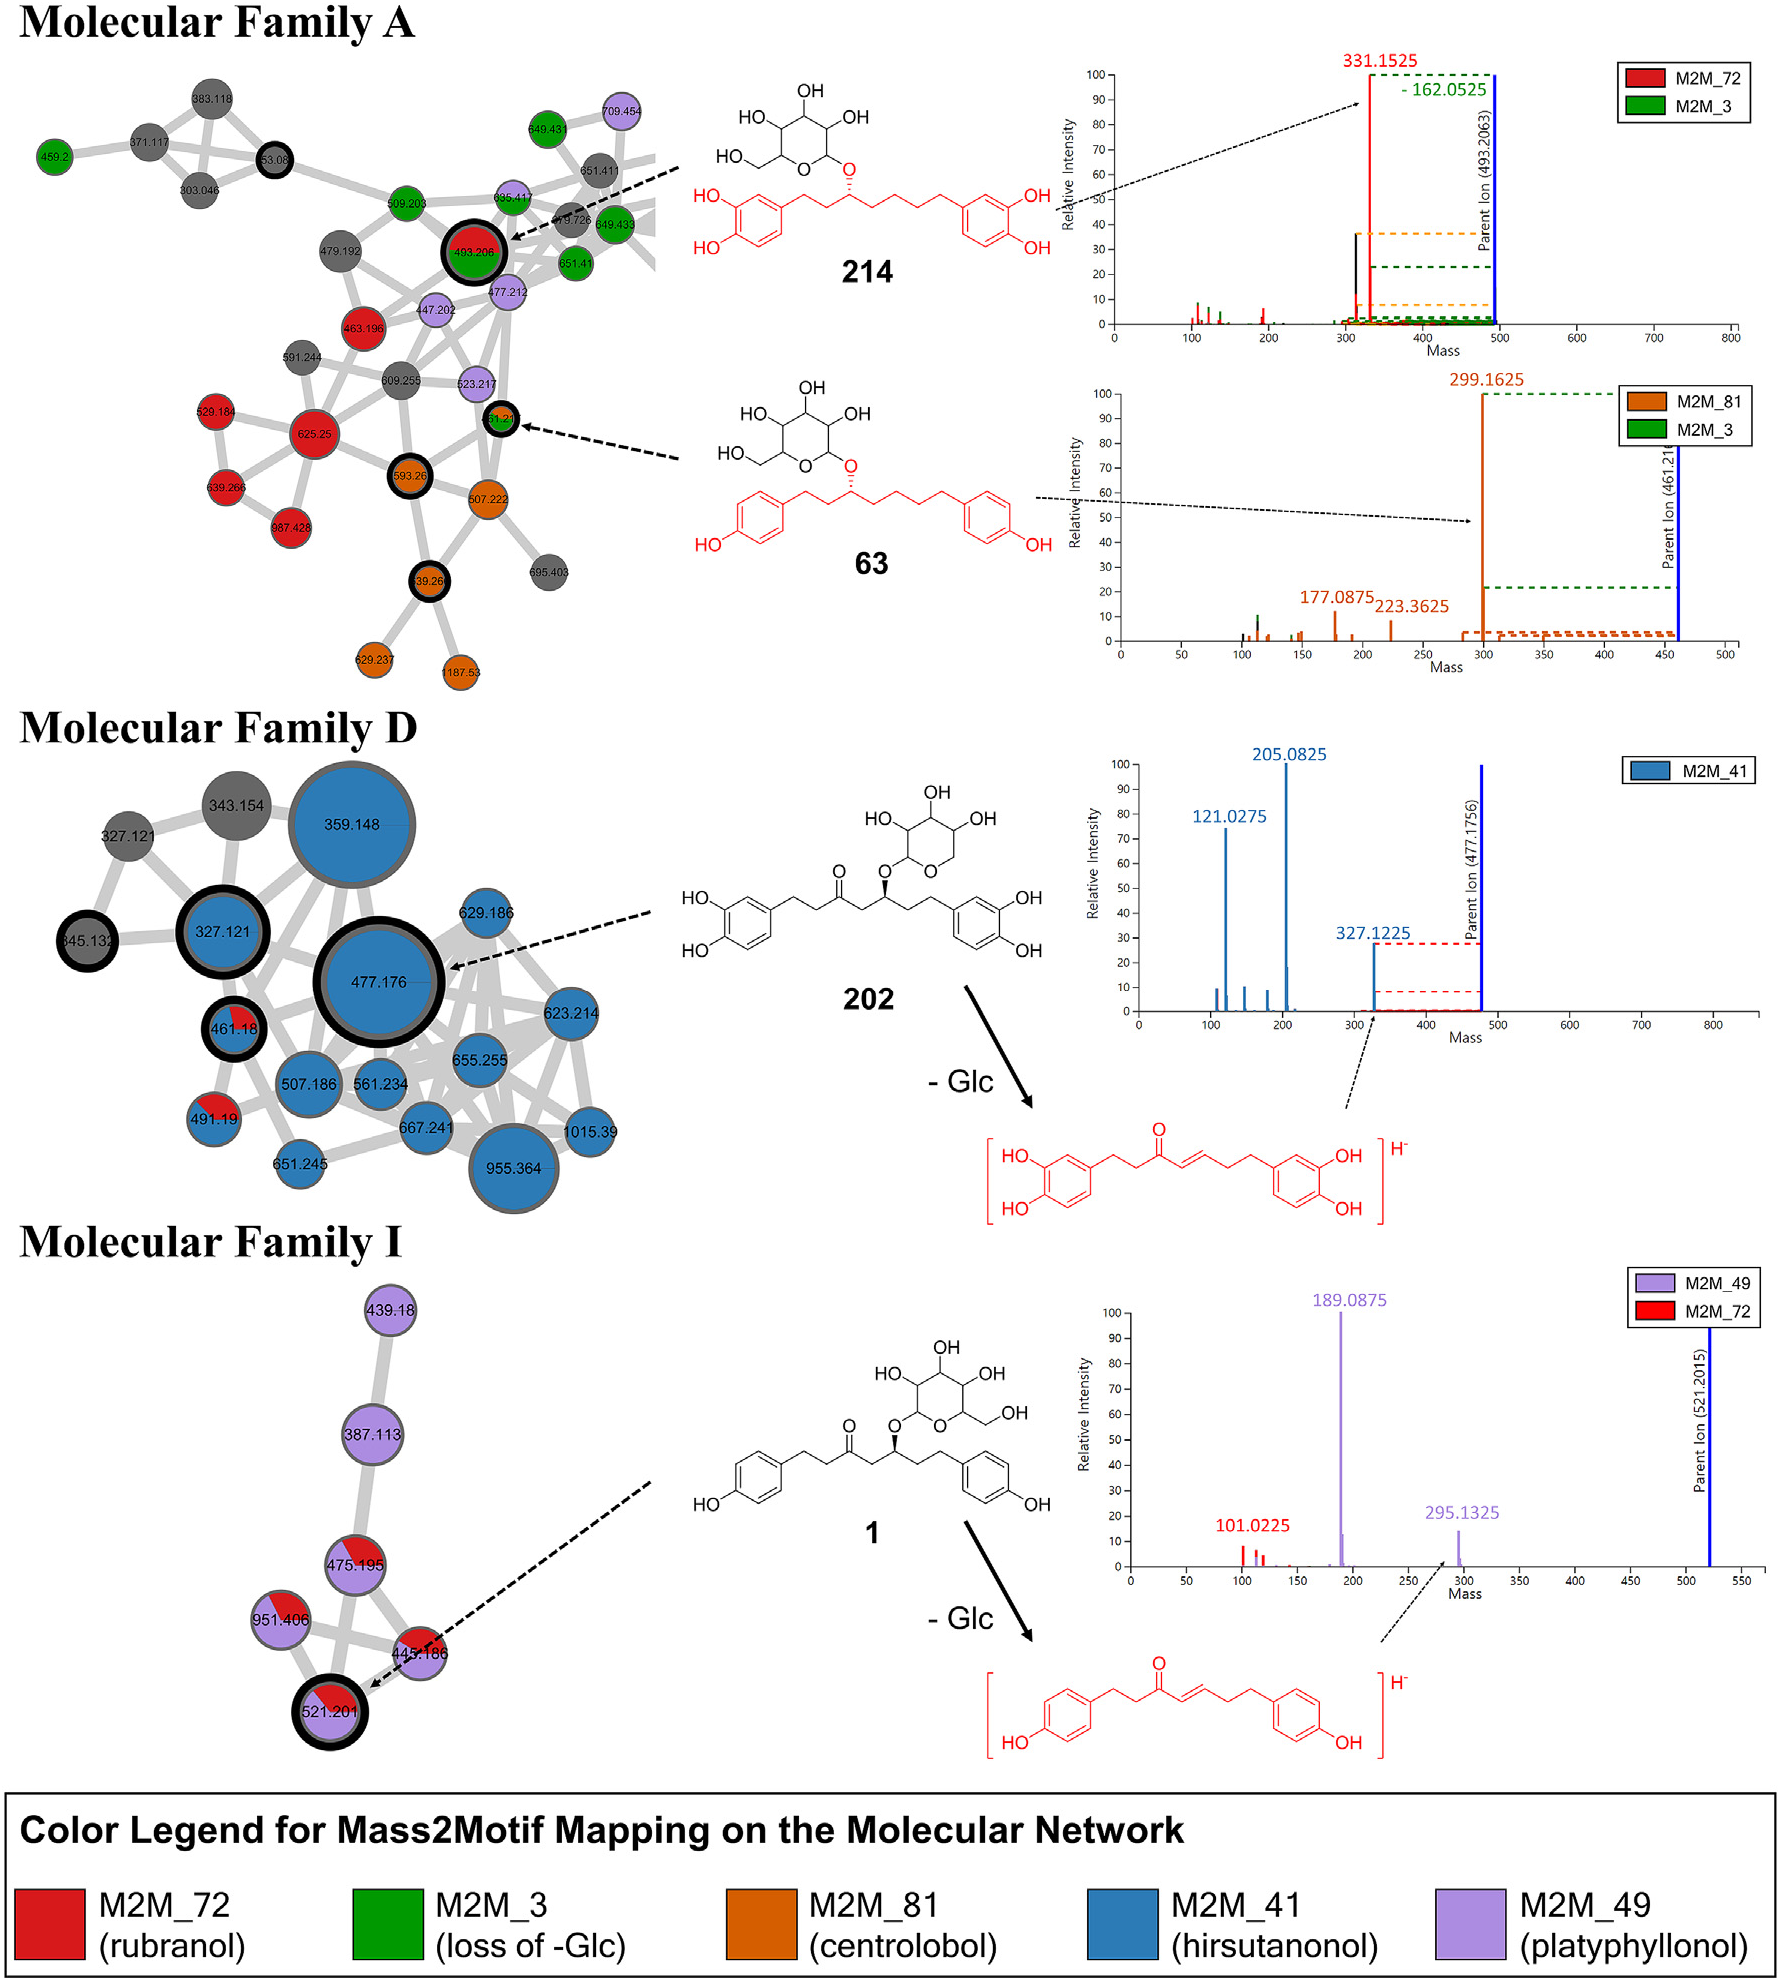
As described in previous studies (Ernst et al., 2019a; Kang et al., 2019), the MolNetEnhacer workflow takes advantage of MS2LDA, which provides information about substructural diversity within same classes of metabolites ( van der Hooft et al., 2016). MS2LDA extracts patterns of fragment ions or neutral losses which are observed together in multiple spectra, called Mass2Motifs, which can show how the compounds in same chemical classes are different in their substructure. For example, Mass2Motifs 41, 49, 72, and 81 were extracted from MS/ MS spectra which are clustered as molecular families A, D, and I, which are annotated as diarylheptanoids. These Mass2Motifs were annotated to represent diarylheptanoid scaffolds which are different in the pattern of unsaturation and hydroxylation. As shown in Fig. 3 View Fig , Mass2Motif 72 represents the presence of a fragment ion m/z 331.1525 ([C 19 H 23 O 5] −) while Mass2Motif 81 represents the presence of a fragment ion m/z 299.1625 ([C 19 H 23 O 3] −), and these two Mass2Motifs are observed in MS/MS spectra 214 and 63, respectively. Mass2Motif 3 represents the neural loss of m/z 162.0525, which is caused by the loss of a hexose moiety, often related to glucose, and commonly observed in plant metabolomics data. GNPS spectral library matching annotated these spectra as rubranoside A ( 214) and aceroside VII ( 63). Based on these annotations, Mass2Motifs 72 and 81 could be annotated as rubranol- and centrolobol-related motifs, respectively. Similarly, Mass2Motifs 41 and 49 were annotated as hirsutanonol- and platyphyllonol-related motifs, mainly based on spectral annotation of oregonin ( 202) and platyphylloside ( 1) ( Fig. 3 View Fig ). These Mass2Motifs also represent a few fragment ions with smaller m/z values; and we confirmed that these fragment ions are identical to the previously reported characteristic fragment ions generated from each diarylheptanoid aglycone. MS/MS fragmentation pathways of diarylheptanoids under ESI negative ion mode were well established by previous studies ( Riethmüller et al., 2015, 2013), and fragment ions represented by Mass2Motifs 41 and 49 agree with the fragmentation patterns described in these studies. Thus, we could demonstrate the potential of MS2LDA, which facilitates the structural annotation of substructures and the storing of these annotations within MS2LDA experiments. These annotated Mass2Motifs can now also be stored in MotifDB ( Rogers et al., 2019). In this way, expert knowledge is made available for future substructure annotations based on MS/MS data. By mapping the distribution of Mass2Motifs on to the molecular network, we could visualize the substructural differences within molecular families ( Fig. 3 View Fig ), which is helpful during annotation and identification of MS/MS spectra within a molecular network.
2.2. Chemotype discrimination of Alnus extracts
Based on the molecular network and structural annotation, chemical diversity between Alnus extracts were systematically analyzed. As a first step, the dissimilarity between samples was calculated. In most metabolomics studies, the diversity between samples has been analyzed by using multivariate analysis techniques such as principal component analysis (PCA) ( Worley and Powers, 2012), which is based on the Euclidean distance metric or principal coordinate analysis (PCoA) which can be based on different distance metrics such as for example the Bray-Curtis dissimilarity ( Brückner and Heethoff, 2017). However, these conventional methods consider each feature as independent entities, ignoring the structural relationship between molecules. To reflect the chemical similarity at the scaffold level shared by samples from the same plant parts, we applied the Chemical Structural and Compositional Similarity (CSCS) metric ( Brejnrod et al., 2019; Sedio et al., 2017), which accounts for the chemical structural similarity across metabolites by integrating the MS/MS spectral similarity calculated in the process of GNPS molecular networking.
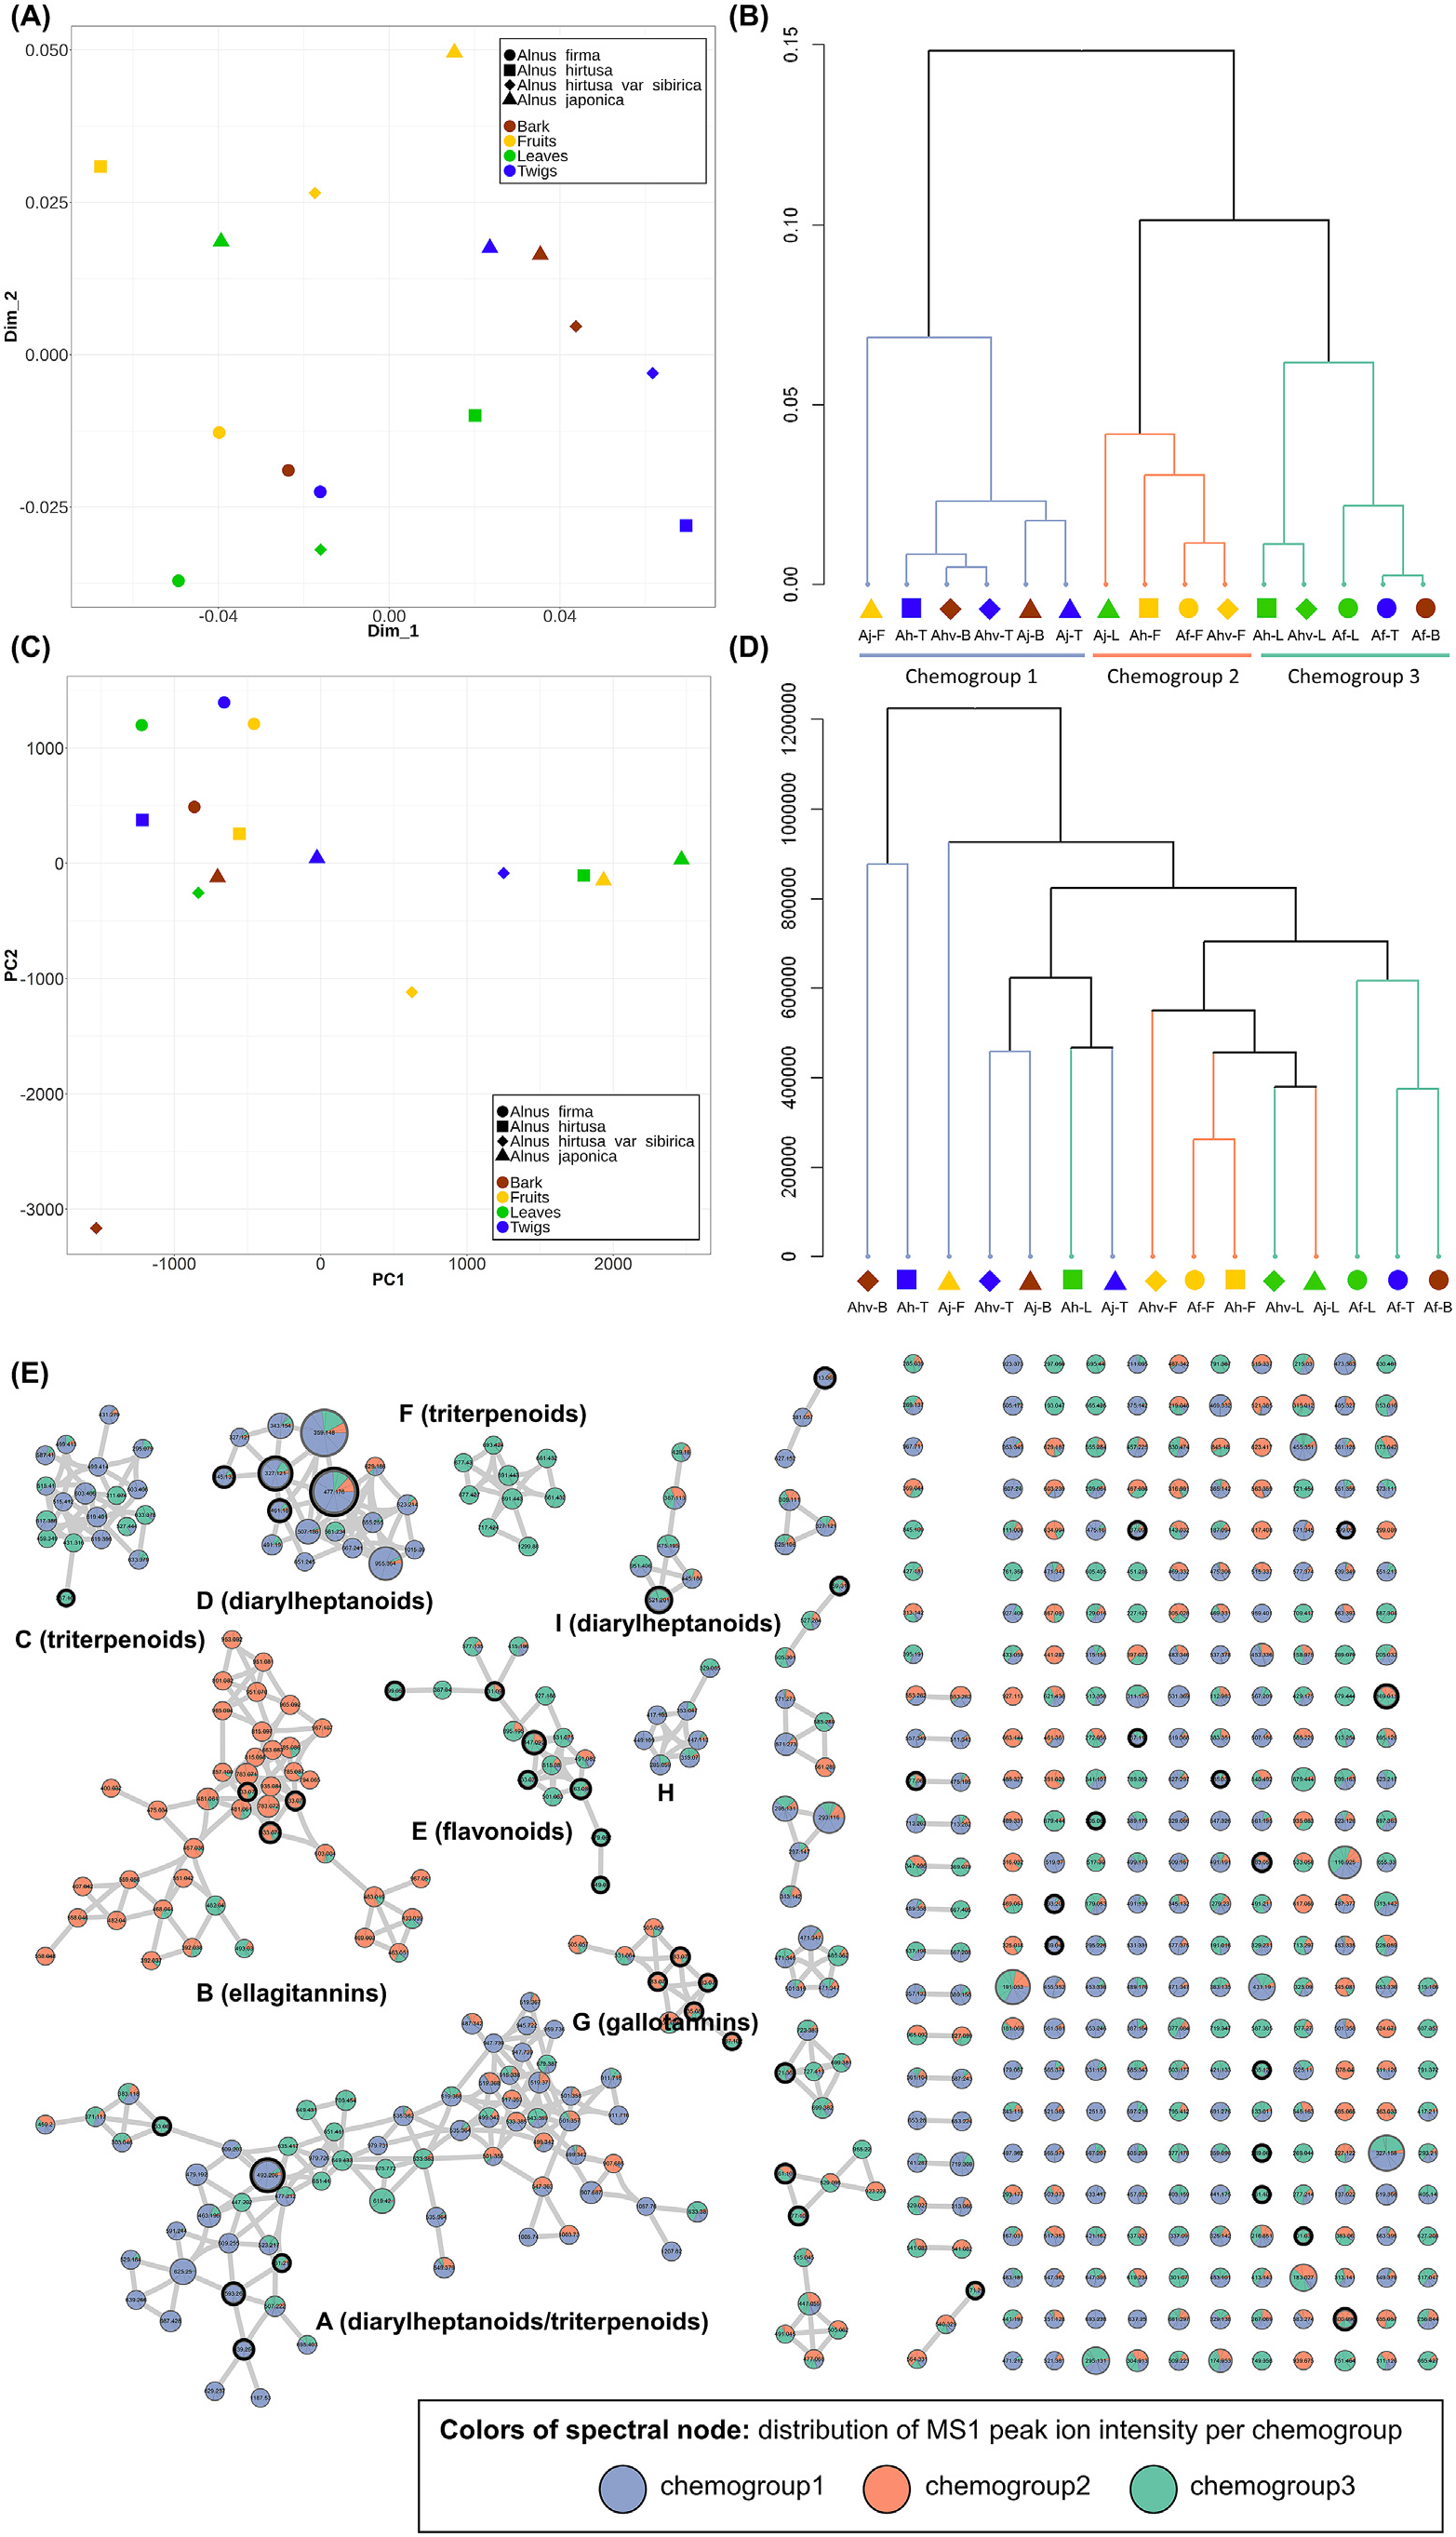
Compared to the PCA score plot ( Fig. 4C View Fig ) or hierarchical cluster analysis using the Euclidean distance ( Fig. 4D View Fig ), the weighted (by intensity of MS1 ion intensities) CSCS metric showed clearer discriminative patterns both in a Principle Coordinates Analysis (PCoA) ( Fig. 4A View Fig ) as well as the chemical dendrogram ( Fig. 4B View Fig ); especially the chemodendrogram revealed that the samples can be discriminated as three chemotypes. By mapping these chemotype-classes on the molecular network, the major differences in their metabolites were easily visualized ( Fig. 4E View Fig ). Chemogroup 3 (Ah-L, Ahv-L, Af-L, Af-T, and Af-B) showed high contents of the molecular family E, which was annotated as flavonoids, while Chemogroup 2 (Aj-L, Ah-F, Af-F, and Ahv-F) was rich in tannins. On the other hand, diarylheptanoids were majorly represented in the remaining samples (Chemogroup 1). This pattern partially agreed with the plant parts-based distribution ( Fig. 2 View Fig ), but it could be revealed that there are some exceptional cases such as Aj-F (rich in diarylheptanoids while the other fruits are abundant in tannins), Aj-L (rich in tannins while the other leaves are abundant in flavonoids), and Af-T and Af-B (rich in flavonoids while the other bark and twigs are abundant in diarylheptanoids). It is well known that plant specialized metabolite profiles vary based on a number of biotic as well as abiotic factors, such as diurnal changes, presence of herbivory or plant symbionts, nutrient availability and exposure to sunlight ( Bednarek and Osbourn, 2009; Wink, 2010). We were not able to explain the biological context of these exceptional localizations in A. firma and A. japonica as metadata collected did not allow for a precise evaluation of contributing factors to the differences of the metabolic profiles observed here; however, differences in chemical profiles revealed here will provide a helpful guidance for further phytochemical studies on Alnus species.

No known copyright restrictions apply. See Agosti, D., Egloff, W., 2009. Taxonomic information exchange and copyright: the Plazi approach. BMC Research Notes 2009, 2:53 for further explanation.
|
Kingdom |
|
|
Phylum |
|
|
Class |
|
|
Order |
|
|
Family |
|
|
Genus |