
Uromacer Duméril & Bibron, 1853
|
publication ID |
https://doi.org/ 10.5281/zenodo.187018 |
|
DOI |
https://doi.org/10.5281/zenodo.6220107 |
|
persistent identifier |
https://treatment.plazi.org/id/674E87DD-F74B-FFE9-FF36-9366CACCBE63 |
|
treatment provided by |
Plazi |
|
scientific name |
Uromacer Duméril & Bibron, 1853 |
| status |
|
Genus Uromacer Duméril & Bibron, 1853
Type species. Uromacer oxyrhynchus Duméril and Bibron, 1853:722 .
Diagnosis. See diagnosis for the subtribe Uromacerina .
Content. Three species (13 species + subspecies) are included in the genus ( Table 1).
Distribution. The genus occurs on Hispaniola ( Fig. 2 View FIGURE 2 ).
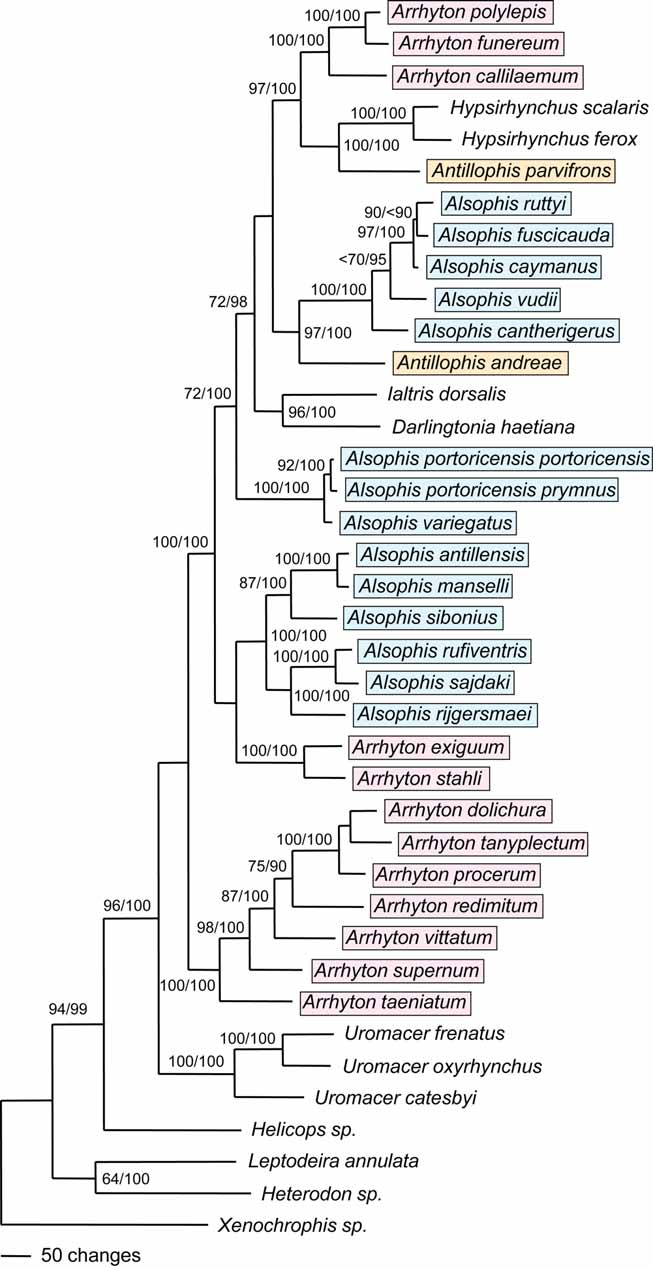
Remarks. Uromacer ( Fig. 3 View FIGURE 3 H) is known only from Hispaniola and includes three species ( Table 1; Fig. 2 View FIGURE 2 ). All are arboreal, and they are the only West Indian alsophiines occupying an arboreal niche. As is typical of arboreal species, they are slender-bodied, and two of the species ( U. frenatus and U. oxyrhynchus ) are more slender than U. catesbyi and feed exclusively on lizards; U. catesbyi feeds on lizards and frogs ( Henderson 1984; Henderson et al. 1987). As expected, U. frenatus and U. oxyrhynchus are closest relatives ( Figs. 1 View FIGURE 1. A and 4 View FIGURE 4. A ); we place them here in the oxyrhynchus Group and place U. catesbyi in the catesbyi Group. All three species have green on their bodies, as concealing coloration, consistent with many arboreal species of snakes. There is considerable geographic variation in morphology within at least two of the species ( U. catesbyi and U. frenatus ) which has led to the recognition of 12 subspecies ( Table 1) ( Cochran 1941; Horn 1969; Schwartz 1970, 1976), some of which may prove to be distinct species.
Timescale of alsophiine snake evolution. A timetree of alsophiine snakes using the four calibrations shows a relatively recent origin for the West Indian clade ( Fig. 4 View FIGURE 4. A ), between 16.8 (23.2–12.4) Ma and 12.5 (17.4–8.92) Ma. Divergences among species or groups of species within the clade range from 12.5 (17.4–8.92) Ma to 0.41 (0.71–0.20) Ma ( Table 3). Eighteen of the alsophiine taxa included in the figure (species and subspecies) diverged from their closest relatives within the Pleistocene (1.81–0.01 Ma), another nine taxa diverged from their closest relatives within the Pliocene (5.33–1.81 Ma), and the remaining eight diverged from their closest relatives within the Miocene (23.0–5.33 Ma). Lineages leading to the three subtribes arose early and approximately at the same time, between 12.5 (17.4–8.92) Ma and 11.1 (15.4–7.91) Ma.
Node Time CI Node Time CI Node Time CI 1 20.5 28.2–16.2 14 6.80 9.62–4.53 27 1.72 2.68–1.03 2 16.9 24.4–12.3 15 6.55 9.49–4.52 28 1.67 2.61–1.02 3 16.8 23.2–12.4 16 6.16 8.83–4.31 29 1.45 2.27–0.84 4 12.5 17.4–8.92 17 5.95 8.65–4.05 30 1.36 2.16–0.79 5 11.1 15.4–7.91 18 5.45 7.75–3.73 31 1.31 2.16–0.74 6 9.24 12.8–6.56 19 5.25 7.69–3.34 32 1.29 2.16–0.65 7 8.84 12.3–6.25 20 5.17 7.66–3.36 33 0.74 1.36–0.34 8 8.52 11.9–5.90 21 4.50 6.57–2.91 34 0.62 1.16–0.30 9 8.23 11.5–5.75 22 4.36 6.17–2.90 35 0.49 0.85–0.25 10 8.05 11.4–5.53 23 4.25 6.14–2.79 36 0.41 0.71–0.20 11 7.97 11.2–5.61 24 2.55 4.05–1.47 37 0.27 0.54–0.09 12 6.91 9.87–4.73 25 2.33 3.61–1.39
13 6.88 9.90–4.78 26 1.98 3.03–1.27
To examine the influence of the various priors, analyses were done without selected calibrations and altering the rttm prior. After removing the molecular-based, secondary calibration point, leaving only the three geologic calibrations, the divergence time estimates dropped by an average of 8.4%. Removing the 37.2 Ma maximum geologic calibration resulted in an average change of only 0.8% in time estimates. Lowering the ingroup-root (rttm) prior by 12% to 20 Ma lowered divergence times an average of only 2.1% whereas increasing the rttm prior by about the same amount to 25 Ma resulted in an average increase in time estimates of only 0.6%. These results indicate that, as expected, the calibration priors have a larger influence on the posterior time estimates than the rttm prior, but that the differences in either case are relatively minor, especially considering the large credibility intervals.


No known copyright restrictions apply. See Agosti, D., Egloff, W., 2009. Taxonomic information exchange and copyright: the Plazi approach. BMC Research Notes 2009, 2:53 for further explanation.