
Mullus surmuletus, Linnaeus, 1758, Linnaeus, 1758
|
publication ID |
https://doi.org/ 10.26028/cybium/2022-461-003 |
|
DOI |
https://doi.org/10.5281/zenodo.10905211 |
|
persistent identifier |
https://treatment.plazi.org/id/9929103F-D43F-FFD5-6925-D9B42F3D2839 |
|
treatment provided by |
Felipe |
|
scientific name |
Mullus surmuletus |
| status |
|
Morphometry
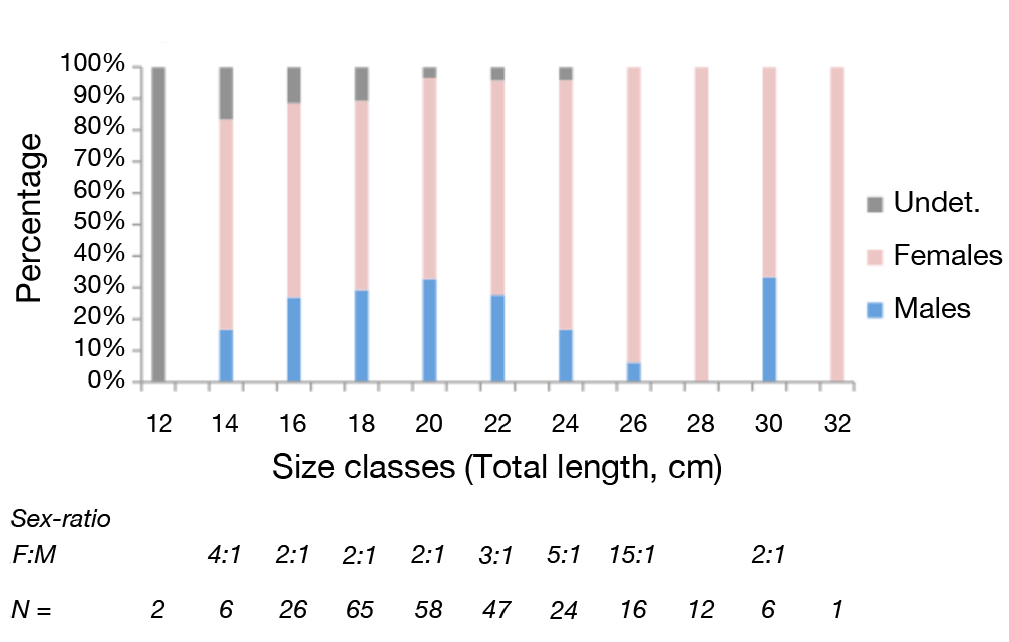
Of a total number of 263 individuals measured, 179 were females, 66 males, and 18 were undetermined, including mostly immature specimens. Their size (TL) ranged between a minimum of 12.2 cm and a maximum of 32.0 cm, with most individuals measuring between 17 and 23 cm ( Fig. 2 View Figure 2 ).
Mean (± SD) total lengths of females (21.5 ± 3.8 cm) and males (20.5 ± 2.9 cm) did not differ statistically (p> 0.05) and were significantly greater than immature individuals (18.1 ± 3.3 cm) (H = 13.65; p = 0.001). The relationship between TL and WT indicated an isometric growth (a = 0.011; b = 3.080), similar between females (a = 0.011; b = 3.074) and males (a = 0.077; b = 3.180).
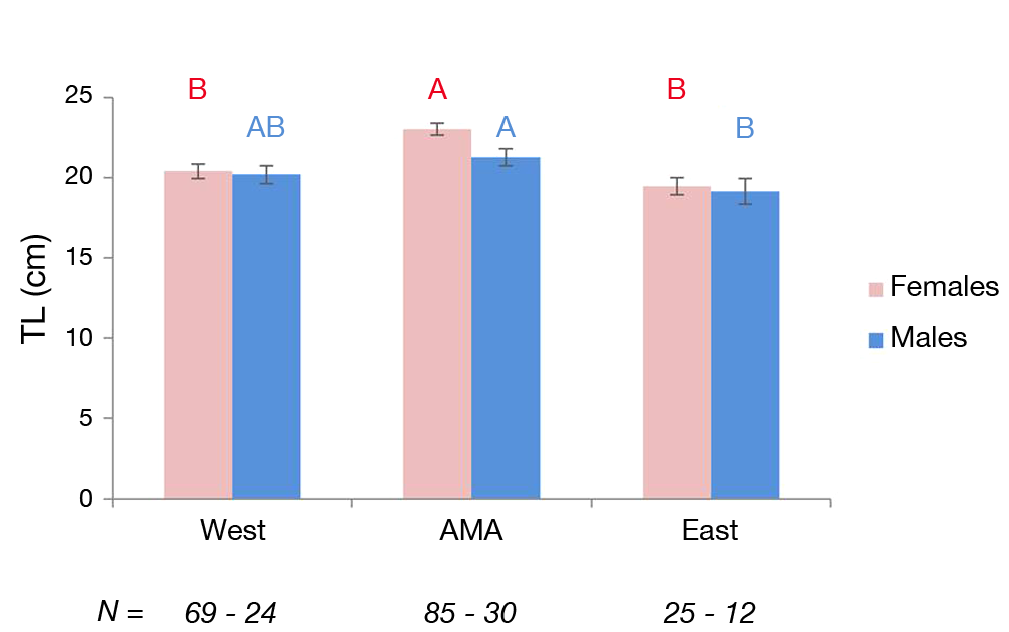
The surmullet sampled in the AMA zone were significantly larger than those sampled in the West and East zones (H = 46.41; p <0.0001) ( Fig. 3 View Figure 3 ). Between-zone differences were significantly higher for females (H = 31.06 p <0.0001) than for males (H = 6.85 p = 0.032). Females measured 23.0 ± 0.4 cm TL in the AMA compared to 20.4 ± 0.5 and 19.5 ± 0.6 cm in the West and East zones, respectively. Males were larger (21.3 ± 0.5 cm) in the AMA than in the East zone (19.2 ± 0.8 cm), but did not significantly differ from those of the West zone (20.2 ± 0.6 cm) ( Fig. 3 View Figure 3 ). On average, larger individuals were sampled in autumn than in spring (H = 10.59; p <0.001), for both females (22.1 ± 0.5 and 21.1 ± 0.4 cm, respectively) and males (22.5 ± 0.8 and 19.6 ± 0.3 cm, respectively) (H = 4.63 p = 0.031 and H = 14.26 p <0.0001, respectively).
Relative body condition
No difference in relative body condition (Kn) was found between males and females (p> 0.05) or between study zones (p> 0.05). Kn was higher in autumn (1.04 ± 0.09) than in spring (0.99 ± 0.10) for the whole population (H = 7.88; p = 0.005). However, contrasted seasonal tendencies occurred between zones with higher mean Kn values in the AMA in spring and in the West zone in autumn (Tab. II).
Reproduction
Sex-ratio
Juveniles dominated the 12 cm TL size class and mature individuals started to dominate from the 14 cm size class (> 75%). Females strongly dominated in all size classes with an increasing female-male sex-ratio with size ( Fig. 2 View Figure 2 ). The sex-ratio was 1: 1 in the 15-16 cm size class and reached 10: 1 in the 26 cm size class. Some size classes larger than 27 cm were even exclusively composed of females.
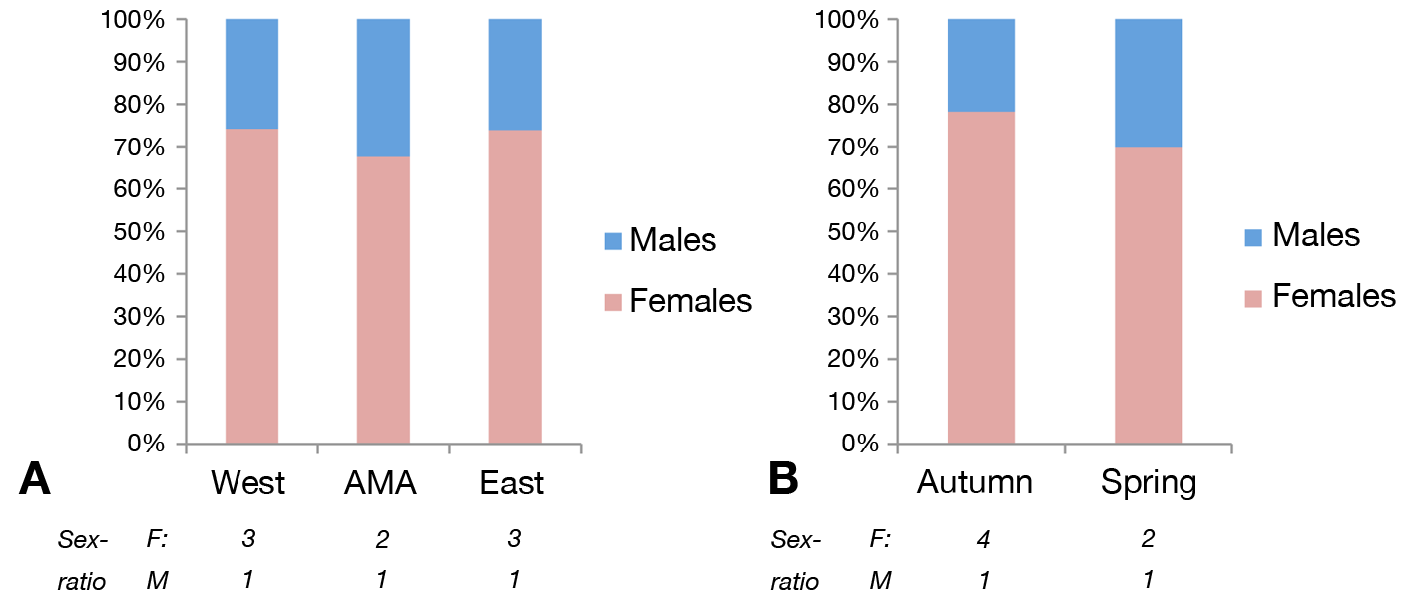
Higher sex-ratio values were measured in the West and East zones (3:1) than in the AMA (2:1) ( Fig. 4A View Figure 4 ), and in autumn than in spring (4:1 and 2:1, respectively) ( Fig. 4B View Figure 4 ).
Gonadosomatic index
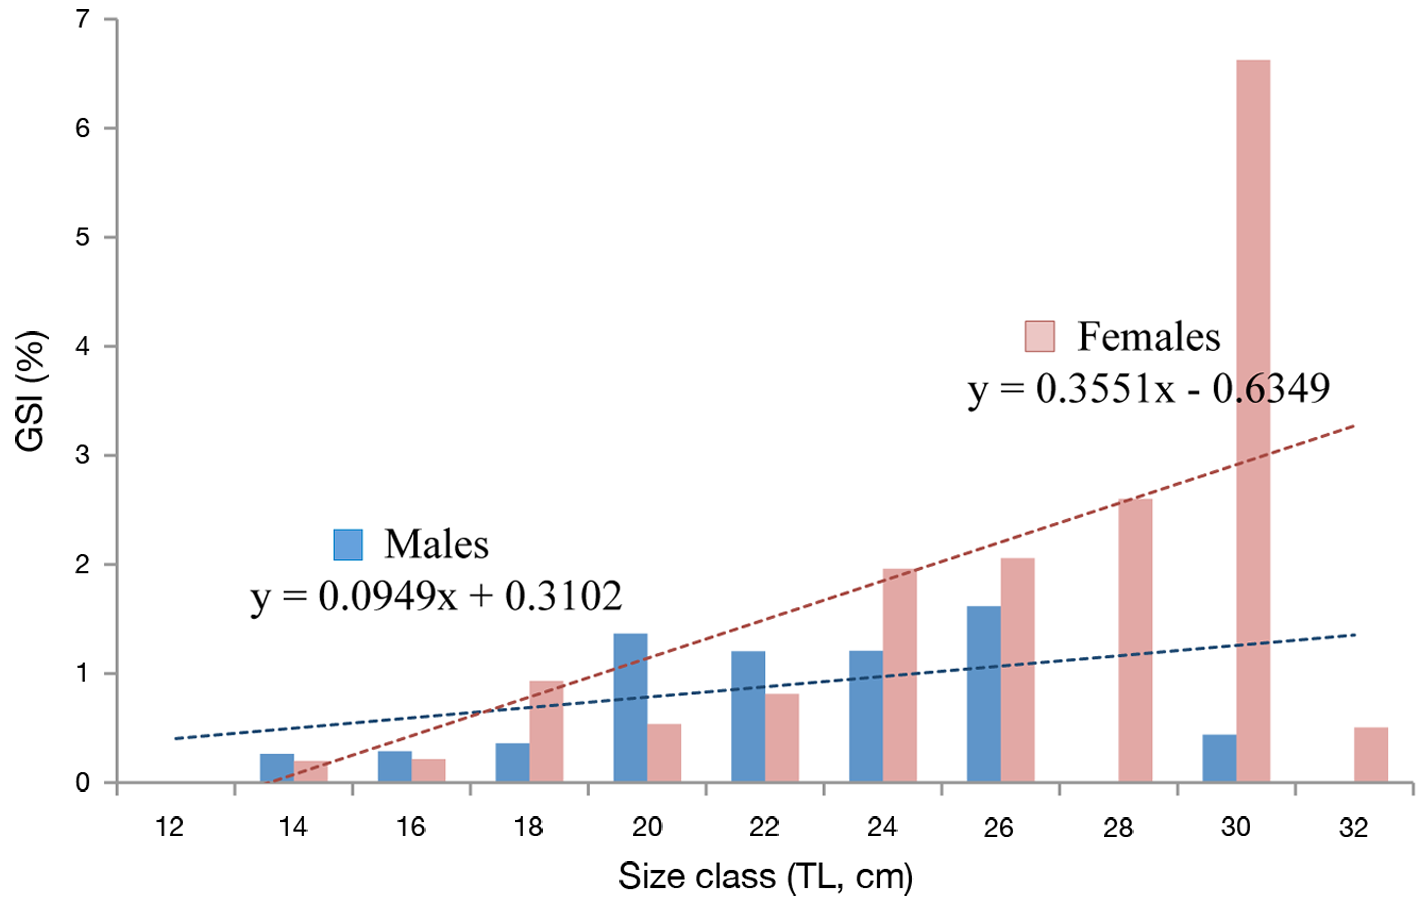
The gonadosomatic index increased with size for both females and males ( Fig. 5 View Figure 5 ). Females showed a higher increase in GSI with size than males. The linear relationships between individual size class and GSI by sex presented a higher slope for females (0.248) than for males (0.030). The highest GSI values were found in the 31 cm size class for females and in the 24 cm size class for males ( Fig. 5 View Figure 5 ).
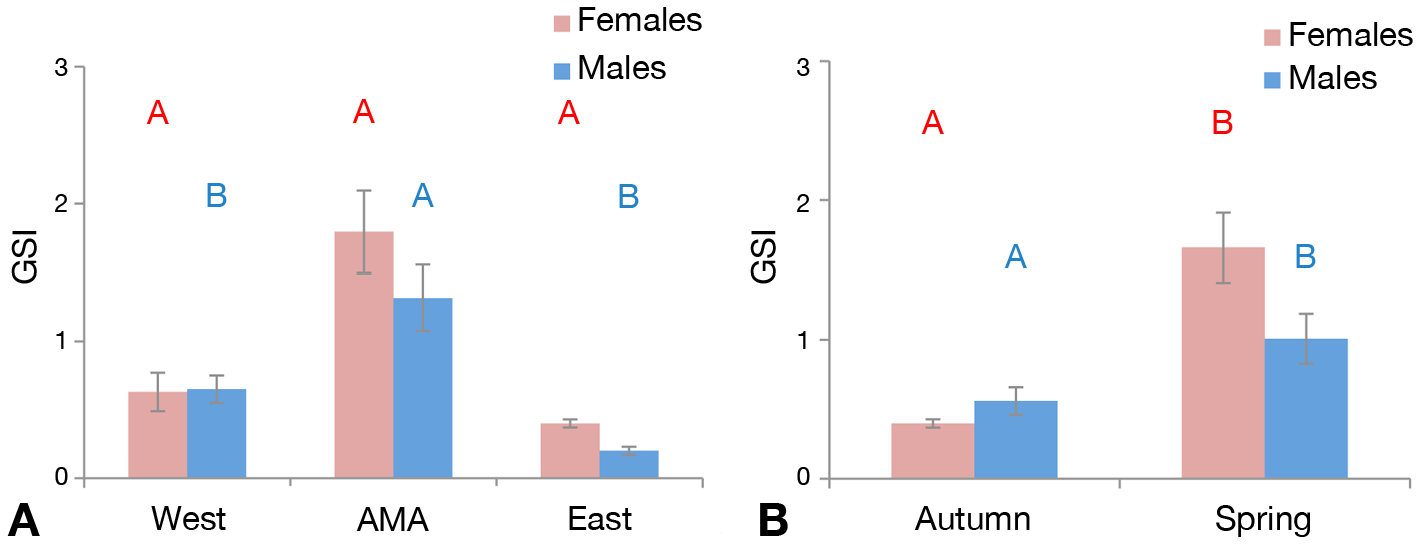
Mean GSI differed among zones only for males (F = 5.39; p = 0.007), with higher values in the AMA compared to the West and East zones ( Fig. 8A View Figure 8 ). The apparently higher GSI for females in the AMA was not significant and was related to the greater individual size of females in this zone (F = 24.35; p <0.0001). Season had a significant effect on GSI independently of size, which was a significant covariate for females and males (F = 54.30; p <0.0001 and F = 10.14; p = 0.002, respectively). Both females and males showed a higher GSI in spring than in autumn (F = 31.35; p <0.0001 and F = 9.19; p = 0.004, respectively) ( Fig. 6B View Figure 6 ). Gonad weight and gonadosomatic index were positively correlated with Kn (p <0.0001; r = 0.28 and respectively p = 0.004; r = 0.18).
Gonadal development stages
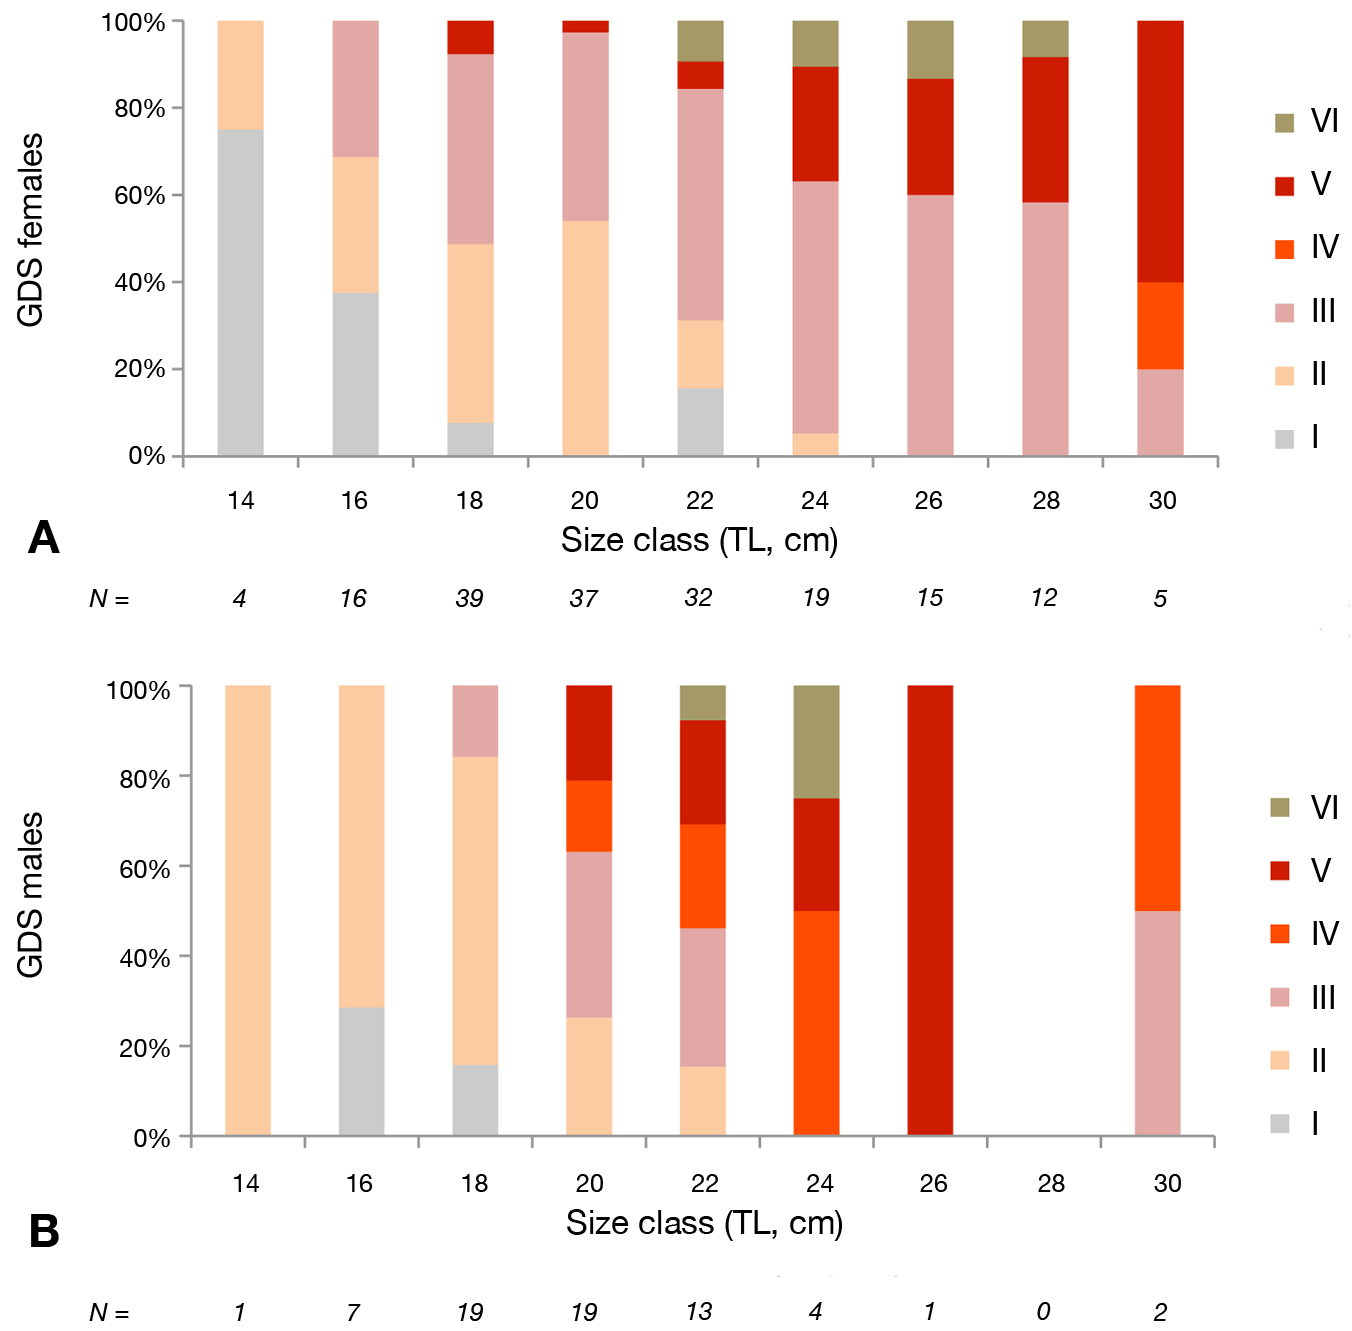
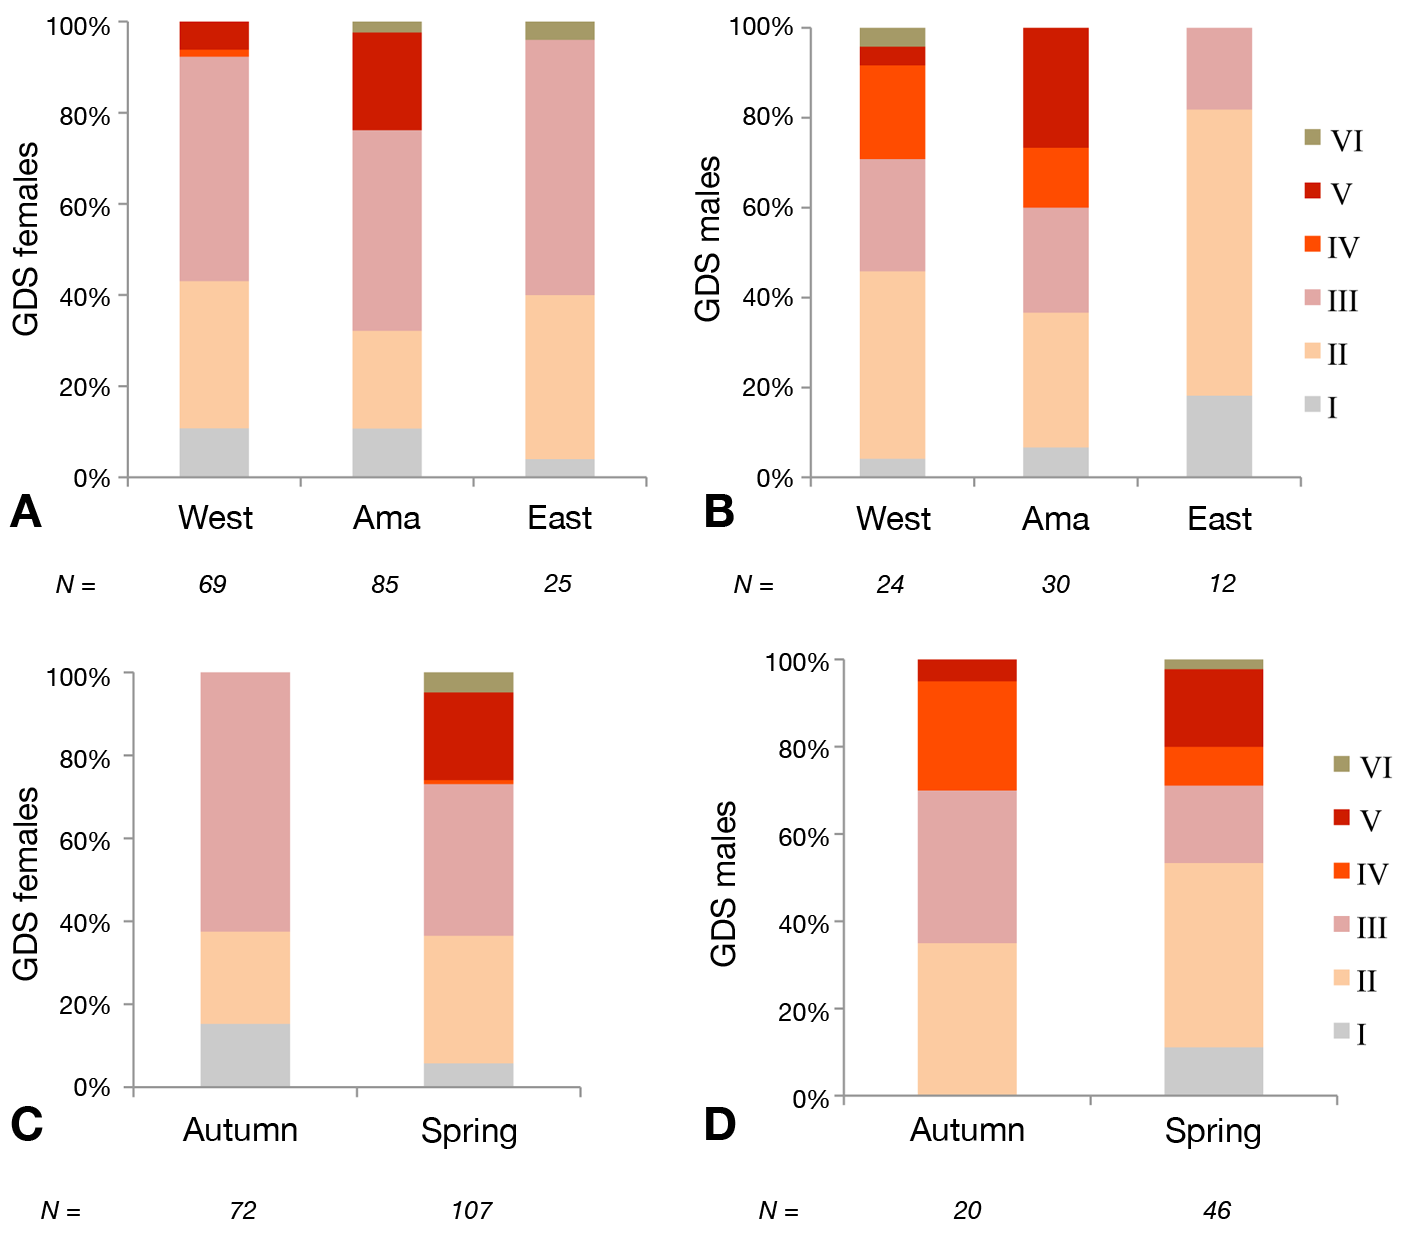
The gonadal development stages increased with size for both females ( Fig. 7A View Figure 7 ) and males ( Fig. 7B View Figure 7 ), but there were no significant differences between females and males (p> 0.05). For females, stage I dominated in the 14 cm size class, stage II in 20 cm, stage III between 22 and 28 cm, while stage V showed its highest percentage in the 30 cm size class ( Fig. 7A View Figure 7 ). For males stage II dominated in size class between 14 and 18 cm, III between 20 and 22 cm, IV in 24 cm, stage V in 26 cm, while stages III and IV were equally represented in 30 cm size class ( Fig. 7B View Figure 7 ). For females, gonadal development stage III dominated in all zones, while stage VI was observed only in the AMA and West zones ( Fig. 8A View Figure 8 ). For males, stage II dominated in all zones ( Fig. 8B View Figure 8 ). For both females and males individuals in stage V were more numerous in the AMA. However, differences in gonadal development stage between zones were not significant (p> 0.05) and were related only to differences in the individual size for both females and males (F = 44.20; p <0.0001 and respectively F = 9.16; p = 0.004).
Lower gonadal development stages dominated in autumn for both females (II and III) (F = 50.12; p <0.0001) ( Fig. 8C View Figure 8 ) and males (II and III) (F = 7.00; p = 0.010) ( Fig. 8D View Figure 8 ). Significant seasonal differences, independent of size, were also observed for both females (F = 70.63; p <0.0001) and males (F = 18.21; p <0.0001). However, development stages in males seemed to be in advance compared to females in autumn, as stage IV and V were observed for males, while stage I were still present in females. More advanced gonadal development stages occurred in spring, with stages IV, V and VI observed in similar percentages in both sexes.
No known copyright restrictions apply. See Agosti, D., Egloff, W., 2009. Taxonomic information exchange and copyright: the Plazi approach. BMC Research Notes 2009, 2:53 for further explanation.