
Artocarpus xanthocarpus, Merr., Merr.
|
publication ID |
https://doi.org/ 10.1016/j.phytochem.2015.07.003 |
|
DOI |
https://doi.org/10.5281/zenodo.10658668 |
|
persistent identifier |
https://treatment.plazi.org/id/B67887E1-FFD1-2862-BA61-056A58BC59F1 |
|
treatment provided by |
Felipe |
|
scientific name |
Artocarpus xanthocarpus |
| status |
|
2.1. Chemical and structural characterization of compounds isolated from A. xanthocarpus View in CoL
Compound 1 was obtained as fine yellowish needles, [OE] D 25 — 206 (c 0.01, methanol). The molecular formula C 25 H 26 O 7 Na was deduced from HRESIMS (m / z 461.1573 [M+Na] +). The IR spectrum exhibited absorption peaks attributable to a hydroxy group (3349 cm — 1), a conjugated carbonyl group (1646 cm — 1), and aromatic rings (1613, 1562, and 1464 cm — 1). The UV spectrum showed absorbance maxima at 340 and 270 nm, typical of a flavone skeleton ( Musthapa et al., 2009). The 1 H NMR spectrum of 1 ( Table 1 View Table 1 ) indicated the presence of a 3,3-dimethylallyl group at δ 1.65 (3H, s, CH 3 -17), 1.78 (3H, s, CH 3 -18), 3.36 (2H, d, J = 7.2 Hz, H-14), and 5.28 (1H, br t, J = 7.2 Hz, H-15). The UV spectrum did not show a bathochromic shift after addition of a AlCl 3 shift reagent, suggesting a C-6 substitution pattern on the prenyl group ( Nomura et al., 1978). An ABX coupling system with resonances at δ 6.67 (1H, d, J = 2.4 Hz, H-3 0), 6.72 (1H, dd, J = 8.8, 2.4 Hz, H-5 0), and 7.92 (1H, d, J = 8.8 Hz, H-6 0) was assigned as ring B. Two methyl groups at δ 1.34 (3H, s, CH 3 -12) and 1.36 (3H, s, CH 3 -13) and an AMX coupling system at δ 2.59 (1H, dd, J = 16.4, 9.6 Hz, H-9a), 3.51 (1H, dd, J = 16.4, 2.0 Hz, H-9b), and 4.02 (1H, dd, J = 9.6, 2.0 Hz, H-10) suggested the characteristics of an oxepin ring ( Hakim et al., 1999; Musthapa et al., 2009). The 13 C NMR signals at δ 25.7(C-9), 92.3(C-10), and 73.1 (C-11) were similar to those of artelastinin ( Kijjoa et al., 1998), indicating that the prenyl side-chain at C-3 is cyclized with a hydroxy group at C-2 0. Based on these observations, compound 1 could be assigned as shown, and is designated artoxanthocarpuone A.
Compound 2 was obtained as a yellowish powder with a molecular formula of C 31 H 30 O 8, as deduced from HRESIMS ([M+H] + at m / z 531.2016). Its IR spectrum showed absorption bands attributable to a hydroxy (3449 cm — 1), carbonyl in cyclopentanone and ester (1734 cm — 1), conjugated carbonyl (1652 cm — 1), and benzene (1604 and 1470 cm — 1) functional groups. The UV spectrum of 2 was similar to that of artoindonesianin C ( Makmur et al., 2000) and was consistent with a xanthone skeleton ( Zou et al., 2005). The 1 H and 13 C NMR spectra of 2 ( Table 1 View Table 1 ) were similar to those of artoindonesianin C, ( Makmur et al., 2000) including the presence of a 2,2-dimethylpyran ring, an isopropenyl group, two methylene protons, and one methoxy group. An aromatic proton at δ 8.22 (1H, s, H-8) displayed a carbonyl anisotropic effect, which is characteristic of a xanthone skeleton. In addition, the two hydroxy signals at δ 5.52 and 12.95 were exchangeable with D 2 O, and the C-1 hydroxy group was shifted downfield at δ 12.95 (1H, br s, OH-1), due to a hydrogen bond interaction with the C-9 carbonyl group. By comparison with the spectrum of artoindonesianin C, compound 2 includes a 3,3-dimethylallyl group as characterized by resonances at δ 1.65 (3H, s, CH 3 -19), 1.87 (3H, s, CH 3 -20), 3.61 (2H, d, J = 7.2 Hz, H-16), and 5.39 (1H, br t, J = 7.2 Hz, H-17). The HMBC spectrum ( Fig. 1 View Fig ) established the location of the 3,3-dimethylallyl group at C-4 based on connectivities from the resonance at δ 3.61 (H-16) to δ 110.0 (C-4), 155.3 (C-4a), and 160.5 (C-3). The NOESY correlations between CH 3 -19/H-17 and CH 3 -20/H-16 indicated that CH 3 - 19 is cis and CH 3 -20 is trans to H-17. A 2,2-dimethylpyran ring was fused along C-2 and C-3, as indicated by HMBC correlations from δ 6.68 (H-11) to δ 80.1 (C-13), 106.4 (C-2), 157.2 (C-1), and 160.5 (C-3). The presence of an isopropenyl group located at C-7 was deduced from the presence of HMBC correlations between δ 2.18 ( CH 3 -25) and δ 118.6 (C-26), 139.6 (C-24), and 143.4 (C-7) and the methylene protons (δ 5.04 and 5.25, H 2 -26) with δ 25.9 (C-25), 139.6 (C-24), and 143.4 (C-7). Based on these observations, 2 can be assigned as shown, and was named artoxanthocarpuone B.
Compound 3, a colorless crystal, was assigned a molecular formula of C 26 H 32 O 5 Na by HRESIMS ([M+Na] + at m / z 447.2145). The UV spectrum of 3 resembled those of lakoochin A (8) and 2-arylbenzofuran derivatives ( Shen and Hou, 2008). The IR spectrum showed absorption bands typical of a hydroxy group (3399 cm — 1) and an aromatic ring (1585 cm — 1). The 1 H and 13 C NMR spectra of 3 ( Table 2 View Table 2 ) were similar to those of 8 ( Puntumchai et al., 2004), including two methoxy groups, two singlet aromatic protons, a set of ABX coupling systems, and a 3,3-dimethylallyl group. The identification of CH 3 -11 and -12 on the 3,3-dimethylallyl group were deduced from the NOESY correlations of CH 3 -11/H-8 and CH 3 -12/H-9. In addition, the presence of resonances at δ 0.98 (6H, s, CH 3 -16 and 17), 1.59-1.63 (2H, m, H-14), and 2.42–2.47 (2H, m, H-13) and an oxygenated quaternary carbon resonance at δ 70.8 in the DEPT spectrum collectively suggest that 3 contains a γ- hydroxyisoamyl chain. The other resonances at C-2 to C-12, C-1 0 to C-6 0, and two methoxy groups at C-3 0 and -5 0 in the 13 C NMR ( Table 2 View Table 2 ) spectrum closely resembled those of 8 ( Puntumchai et al., 2004). The hydroxy group was assigned to be at C-15 based on HMBC correlations from δ 0.98 ( CH 3 -16 and 17) and 1.59–1.63 (H-14) to δ 70.8 (C-15). Furthermore, the attachment of the γ- hydroxyisoamyl chain to C-6 0 was established by comparison with the spectra for compound 8 and was confirmed by the observation of HMBC correlations from δ 2.45 (H-13) to δ 46.1 (C-14), 70.8 (C-15), 125.6 (C-6 0), and 133.5 (C-1 0) ( Fig. 1 View Fig ). Since compound 3 is the C-15 hydration product of lakoochin A (8), it was named as hydroxylakoochin A.
Compound 4 was isolated as an off-whitish powder and [OE] D 25 +3.7 (c 0.09, methanol). Its molecular formula was assigned as C 27 H 34 O 6 Na based on HRESIMS ([M+Na] + at m / z 477.2255). The UV spectrum was typical for a 2-arylbenzofuran derivative ( Shen and Hou, 2008) and was similar to that of compound 3. The IR spectrum showed absorption values attributable to a hydroxy group (3369 cm — 1) and aromatic rings (1624 and 1586 cm — 1). The 1 H NMR spectrum of 4 was similar to that of compound 3 except for an oxymethine proton (δ 3.59–3.63, 1H, m, H-14) instead of methylene protons (δ 1.59–1.63, 2H, m, H-14) at C-14, and the presence of an additional methoxy group at δ 2.99 (3H, s, OCH 3 -14). The spectra suggested that the methoxy group was on the γ- hydroxyisoamyl chain, and this was confirmed by multiple HMBC correlations, including OCH 3 -14 (δ 2.99)/C-14 (δ 77.9), Ha- 13 (δ 2.58) and Hb- 13 (δ 2.74)/C-14 (δ 77.9), and CH 3 -16 (δ 0.93) and -17 (δ 0.96)/C-15 (δ 78.3) ( Fig. 1 View Fig ). The HMBC correlations of H-13 to C-6 0 (δ 122.7), C-1 0 (δ 134.5), and C-5 0 (δ 158.5) confirmed that the β- methoxy-γ- hydroxyisoamyl unit was attached to C-6 0 ( Fig. 1 View Fig ). The 13 C NMR spectroscopic data ( Table 2 View Table 2 ) and ESI-MS results also supported the structure shown for 4 ( Fig. 1 View Fig ). Collectively, these findings indicated that compound 4 is methoxylakoochin A.
Compound 5 was isolated as a yellowish amorphous powder and [OE] D 25 +38.2 (c 0.01, methanol). The molecular formula of C 27 H 32 O 6 Na was determined by HRESIMS ([M+Na] + at m / z 475.2093). The UV and IR spectra were typical for a 2-arylbenzofuran derivative ( Shen and Hou, 2008) and were similar to those of compounds 3 and 4. The 1 H and 13 C NMR spectra of 5 ( Table 2 View Table 2 ) were similar to those of compounds 3 and 4. The 1 H NMR spectrum indicated the presence of two methyl groups (δ 0.94 and 1.18) and two oxymethine protons (δ 3.36 and 4.04) that were not present in 3 or 4, and the spectrum of 5 did not have resonances corresponding to the 3,3-dimethylallyl side-chain in 8 ( Puntumchai et al., 2004). The 1 H– 1 H COSY and HMQC data of 5 established the connectivities of H-13 (δ 4.04)/H-14 (δ 3.36), H-13 (δ 4.04)/C-13 (δ 79.4), and H-14 (δ 3.36)/C-14 (δ 66.7). The HMBC correlations of CH 3 -16 and -17 (δ 0.94 and 1.18)/C-15 (δ 56.8), CH 3 -16 and -17/C-14 (δ 66.7), H-13 (δ 4.04)/C-15 (δ 56.8), C-14 (δ 66.7), and OMe-13 (δ 57.0) confirmed the presence of a 2,3-epoxy-3,3-dimethyl-1-oxygenerated propane moiety ( Jeong et al., 2009). Furthermore, the HMBC correlations between H-13 (δ 4.04)/C-6 0 (δ 119.7), C-1 0 (δ 132.9), and C-5 0 (δ 157.1) indicated that the 2,3-epoxy-3,3-dimethyl-1-methoxy propanyl moiety was attached to C-6 0. Hence, it was concluded that compound 5 was as shown, and it was named epoxylakoochin A.
Compound 6 was obtained as a brownish amorphous powder, [OE] D 25 — 3.1 (c 0.05, methanol). The molecular formula C 36 H 30 O 10 Na was deduced from HRESIMS ([M+Na] + at m / z 645.1734). The IR spectrum showed characteristic absorption bands of a hydroxy group (3342 cm — 1) and a benzene ring (1612 and 1516 cm — 1). The UV spectrum of 6 was similar to that of alboctalol (9) ( Royer et al., 2010). The 1 H NMR spectrum showed one pair of methylene protons at δ 2.21 (1H, br s, Hax- 6) and 2.42 (1H, dd, J = 15.6, 3.2 Hz, Heq- 6), five methine protons at δ 3.45 (1H, br s, H-4b), 3.57 (2H, br s, H-5 and H-10b), 4.40 (1H, br s, H-11), and 4.93 (1H, br s, H-12). The hydroxy signals at δ 6.92, 7.40, 7.71, 7.81, 7.97 and 8.14 were exchangeable by adding D 2 O. In addition, five aromatic systems including three dihydoxylated phenyls and two tetra-substituted benzenes were identified according to the resonances in the 1 H NMR, as well as in the 13 C NMR spectra of 6. From the 1 H NMR spectrum of 6, three dihydroxylated phenyls were verified as one 3,5-dihydroxyphenyl [comprising resonances at δ 6.09 (2H, d, J = 2.0 Hz, H-20 & H-24) and 6.12 (1H, t, J = 2.0 Hz, H-22)] and two 2,4-dihydroxyphenyls [resonances at δ 6.09 (1H, dd, J = 8.4, 2.4 Hz, H-29), 6.33 (1H, d, J = 8.4 Hz, H-30), and 6.35 (1H, d, J = 2.4 Hz, H-27) as one system, as well as at δ 6.21 (1H, dd, J = 8.4, 2.4 Hz, H-17), 6.43 (1H, d, J = 2.4 Hz, H-15), and 6.64 (1H, d, J = 8.4 Hz, H-18) as another system]. The 1 H NMR resonances of the two 1,3,5,6-tetra-substituted benzenes were identified at δ 5.92 (1H, d, J = 2.4 Hz, H-7) and 6.07 (1H, d, J = 2.4 Hz, H-9), as well as at δ 6.15 (1H, d, J = 2.4 Hz, H-4) and 6.18 (1H, d, J = 2.4 Hz, H-2). The above evidence suggested that compound 6 had a polycyclic ring system substituted by four phenolic hydroxys and three dihydroxylated phenyls. The COSY spectrum of 6 showed cross-peaks of δ 3.45 (H-4b) with 3.57 (H-5 and H-10b), δ 3.57 (H-10b) with 4.40 (H-11), and δ 4.40 (H-11) with 4.93 (H-12) that correlated with these aliphatic signals, implying that compound 6 contained a 4b,5,6,10b,11,12-hexahydrochrysene scaffold substituted by three dihydroxylated phenyls ( Collins et al., 1988). After the validation of each proton–carbon attached signals in the HMQC spectrum, the structure of 6 was then established as 1,3,8,10-tetrahydroxy-5,12-di-(2,4-dihydroxyphenyl)-11-(3,5- dihydroxyphenyl)-4b,5,6,10b,11,12-hexahydrochrysene, namely artoxanthol (6), by advanced information obtained from the HMBC spectrum shown in Fig. 1 View Fig . The relative configuration of 6 at H-4b, H-5, H-10b, H-11, and H-12 were found to be all β according to the NOESY experiments illustrated in Fig. 2 View Fig . However, the absolute configuration of 6 is still unidentified because of limited yield.
Although 4b,5,6,10b,11,12-hexahydrochrysene derivatives are known synthetic estrogens ( Collins et al., 1988), compound 6 is the first identified triphenylated hexahydrochrysene at least from a natural source. Apparently, compound 6 is stilbene oligomer of that may have been constructed through a Diels–Alder type reaction, whereby enzymatic catalysis has recently been proved to be efficient ( Kim et al., 2011). The enzyme, namely Diels–Alderase, is now a highlight in chemical biology ( Townsend, 2011). A possible biosynthetic process to 6 was proposed as shown in Fig. 3 View Fig . In this proposal, two molecules of oxyresveratrol experienced a [4 + 2] Diels–Alder type reaction to give alboctalol (9) and/or epialboctalol ( Royer et al., 2010), which is then followed by a phenolic oxidative de-resorcinol elimination process, forming another ligand ( Li et al., 2003) for an additional [4 + 2] reaction that led consequently to the formation of artoxanthol (6). Although the existence of a Diels–Alderase in A. xanthocarpus is still unknown, at least three Diels–Alder type adducts, namely artoxanthol (6), artoxanthochromane (7) ( Ko et al., 2013), and alboctalol (9), have been identified from this plant and other Moraceous plants ( Royer et al., 2010).
The structure of 1 was determined by 1D NMR spectroscopy, whereas, compounds 2–6 were determined by 1D and 2D NMR spectra and by comparing with those of reported analogs. Although compounds 1–6 possess stereogenic centers, the available data did not allow the determination of the stereochemical configuration of these compounds. The other known compounds, including artoxanthochromane (7) ( Ko et al., 2013), lakoochin A (8) ( Puntumchai et al., 2004), alboctalol (9) ( Royer et al., 2010), (—)-catechin (10) ( Lee et al., 1992), steppogenin (11) ( Arung et al., 2007), norartocarpetin (12) ( Jeong et al., 2009), isoetin 5 0 -methyl ether (13) ( Rahman and Moon, 2007), morusin (14) ( Nomura et al., 1978), cyclocommunol (15) ( Lin and Shieh, 1992), albanin A (16) ( Ferrari et al., 1989), cudraflavone C (17) ( Hano et al., 1990), artonin A (18) ( Hano et al., 1989), resveratrol (19) ( Chen et al., 2002), oxyresveratrol (20) ( Zhaxi et al., 2010), chlorophorin (21) ( Christensen et al., 1988), scopoletin (22) ( Lee et al., 2010b), protocatechuic acid, and β -sitosterol, were identified by comparison of their physical and spectroscopic data with literature values.
2.2. Antioxidant activity of compounds isolated from A. xanthocarpus View in CoL
DPPH, ABTS, and superoxide anion radical-scavenging assays were used to evaluate the antioxidant activities of each of the isolated compounds. Compound 18 exhibited strong DPPH radical-scavenging activity comparable to the ascorbic acid positive control ( Table 3 View Table 3 ). Compounds 3, 4, 6, 8–10, and 19–21 had moderate or weak DPPH radical-scavenging activity. In the ABTS cation radical-scavenging assay, compounds 6, 9, 10, 14, and 20 were quite potent, with SC 50 values of 7.6 ± 0.1, 6.5 ± 0.9, 22.7 ± 0.6, 28.0 ± 1.7, and 28.8 ± 0.6 µM, respectively, whereas compounds 4, 7, 18, 19, and 21 showed only moderate activity. The relative activities of these compounds to scavenge superoxide anions are also shown in Table 3 View Table 3 . Notably, compound 10 (SC 50 of 11.1 ± 0.5 µM) was more potent than the ascorbic acid control (SC 50 of 20.6 ± 1.6 µM).
2.3. Mushroom tyrosinase inhibition by compounds isolated from A. xanthocarpus
The inhibitory activity of each compound against mushroom tyrosinase was also evaluated for each compound. Compounds 6, 9, 11, 12, and 19–21 were potent tyrosinase inhibitors, with IC 50 values of 5.7 ± 0.3, 6.4 ± 0.3, 1.9 ± 0.1, 0.9 ± 0.1, 4.9 ± 0.3, 1.0 ± 0.5, and 2.5 ± 0.4 µM, respectively. Compounds 1, 3, 7, 14, 16, and 17 also showed strong inhibitory effects against mushroom tyrosinase ( Table 3 View Table 3 ). Indeed, these compounds were more potent inhibitors than ascorbic acid/arbutin/kojic acid, a well-known whitening agent used in cosmetic applications.
2.4. Effect of compounds isolated from A. xanthocarpus on cell viability of B16F10 melanoma cells
B16F10 melanoma cells were treated with various concentrations of each compound for 48 h, with an XTT assay used to quantify their effect on viability (cell viability details are shown in the Supporting Information). Compounds 6–7, 9–10, 13, 20, and 22 had no significant effect on B16–F10 melanoma cell proliferation at concentrations up to 80 µM ( Table 4 View Table 4 ). Compounds 3–4, 8, 12, 16– 17, and 18 did not affect cell viability at low concentrations (10 or 20 µM). Compound 15 reduced cell viability to 75% at 10 µM, and it was therefore deemed unsuitable for further evaluation. Based on these data, the effects of each compound on melanoma cells were evaluated at non-toxic concentrations in the subsequently described experiments.
2.5. Effects of compounds isolated from A. xanthocarpus on melanin content and tyrosinase activity in B16F10 melanoma cells
To determine the inhibitory effect of compounds on melanin formation and tyrosinase activity, B16F10 melanoma cells were stimulated with 50 nM OE- melanocyte-stimulating hormone (OE- MSH) for 24 h and were then treated with either a vehicle or the compounds at concentrations known to be non-toxic. Importantly, compounds 1–4, 7–8, 10, 14, and 16–21 significantly decreased melanin production compared to cells treated with OE- MSH alone ( Table 4 View Table 4 ). Among these, compounds 1–4, 8, 14, 17, 18, and 21 significantly reduced melanin content to a level less than that observed for control-, OE- MSH-, or positive control-treated cells. Since compound 13 significantly increased melanin production and tyrosinase activity in cellular assays, it can be concluded that it is not a suitable anti-melanogenesis component. Compounds 1–2, 4, 8, 17–19, and 21 also significantly decreased the OE- MSH-induced stimulation of melanin biosynthesis, possibly through a mechanism that involves inhibition of tyrosinase activity. Interestingly, some compounds reduced the melanin content but increased tyrosinase activity (e.g., 10, 12, 14, and 20). Further experiments will be needed to clarify the mechanism of this activity. To quantitatively assess the importance of the prenyl moiety in anti-melanogenesis activity, several compounds with similar skeletons were evaluated in B16F10 cells at the same concentration. Among the flavonoids, the effects of compounds 12, 16, and 17, which contain a resorcinol group in the B ring and varying numbers of prenyl groups, were evaluated at 10 µM. Among the stilbenoids, compounds 19–21, with different numbers of hydroxy/prenyl groups, were evaluated at 40 µM. At the concentrations tested, compounds 17 and 21 with a lipophilic prenyl group exhibited potent inhibition of melanin production and tyrosinase activity ( Table 5 View Table 5 ).
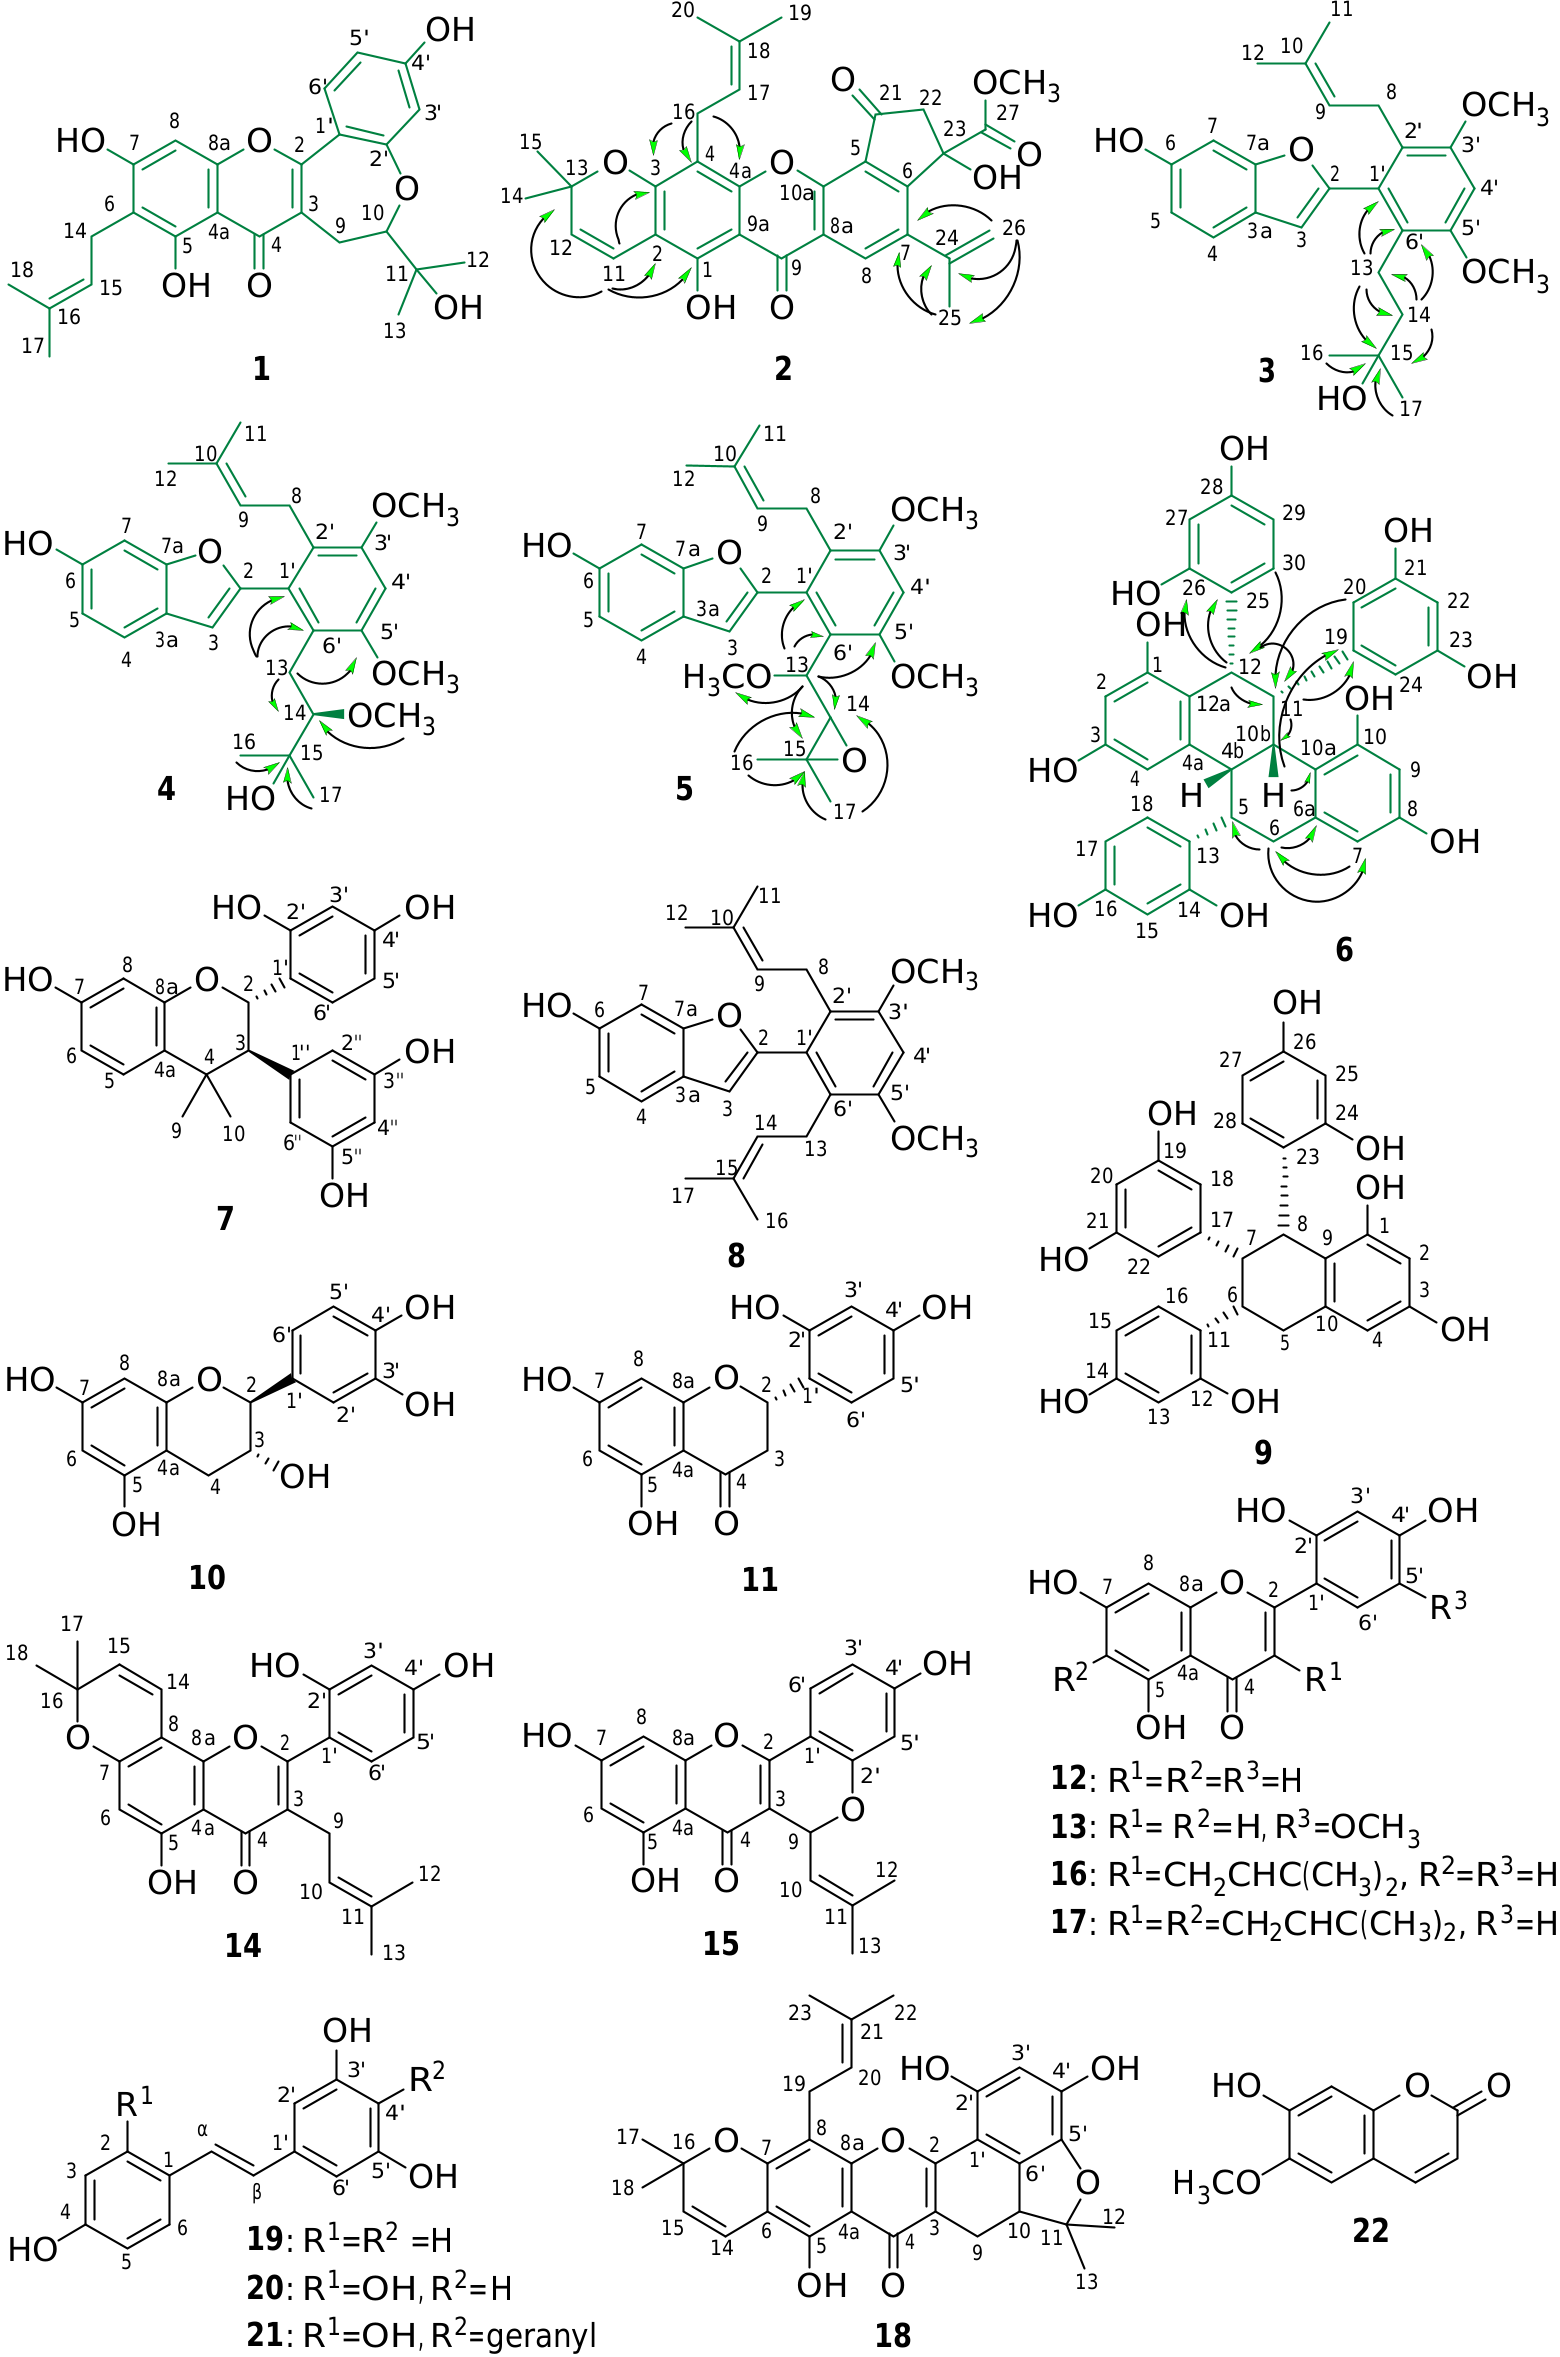
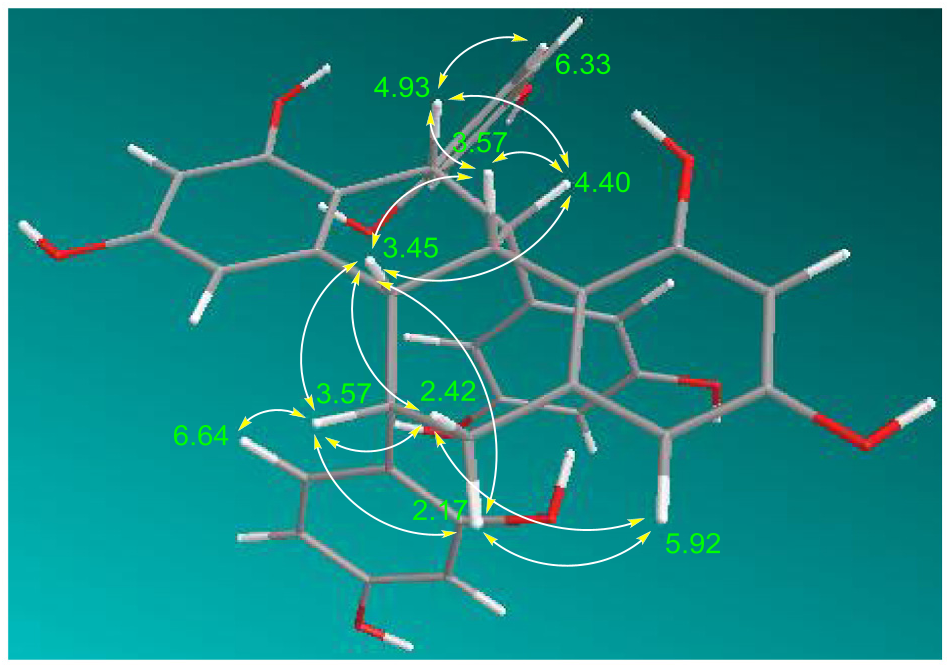
Table 1 1H (400 MHz) and 13C NMR (100 MHz) spectroscopic data of compounds 1, 2, and 6.
| Position | 1 (acetone- d 6) | 2 (acetone- d 6) | 6 (acetone- d 6) | |||
|---|---|---|---|---|---|---|
| δ C, mult. | δ H (J in Hz) | δ C, mult. | δ H (J in Hz) | δ C, mult. | δ H (J in Hz) | |
| 1 | 157.2, C | 157.0, C | ||||
| 2 | 160.7, C | 106.4, C | 107.8, CH | 6.18, d (2.4) | ||
| 3 | 118.0, C | 160.5, C | 156.9, C | |||
| 4 | 182.4, C | 110.0, C | 102.1, CH | 6.15, d (2.4) | ||
| 4a | 104.7, C | 155.3, C | 147.0, C | |||
| 4b | 35.1, CH a | 3.45, br s | ||||
| 5 | 157.1, C | 126.7, C | 40.0, CH b | 3.57, br s b | ||
| 6 | 104.7, C | 159.5, C | 43.8, CH2 | 2.21, br s 2.42, dd (15.6, 3.2) | ||
| 6a | 142.2, C | |||||
| 7 | 162.9, C | 143.4, C | 107.2, CH | 5.92, d (2.4) | ||
| 8 | 94.2, CH | 6.57, s | 133.2, CH | 8.22, s | 156.8, C | |
| 8a | 159.2, C | 122.6, C | ||||
| 9 | 25.7, CH2 | 2.59, dd (16.4, 9.6) 3.51, dd (16.4, 2.0) | 181.2, C | 107.1, CH | 6.07, d (2.4) | |
| 9a | 105.0, C | |||||
| 10 | 92.3, CH | 4.02, dd (9.6, 2.0) | 157.0, C | |||
| 10a | 152.2, C | 117.8, C | ||||
| 10b | 39.9, CH b | 3.57, br s b | ||||
| 11 | 73.1, C | 116.4, CH | 6.68, d (10.0) | 48.2, CH | 4.40, br s | |
| 12 | 25.8, Me | 1.34, s | 129.7, CH | 5.79, d (10.0) | 40.3, CH | 4.93, br s |
| 12a | 118.2, C | |||||
| 13 | 27.9, Me | 1.36, s | 80.1, C | 126.4, C | ||
| 14 | 22.7, CH2 | 3.36, d (7.2) | 29.3, Me | 1.52, s | 156.0, C | |
| 15 | 124.0, CH | 5.28, br t (7.2) | 29.2, Me | 1.51, s | 104.4, CH | 6.43, d (2.4) |
| 16 | 132.3, C | 22.6, CH2 | 3.61, d (7.2) | 157.6, C | ||
| 17 | 26.5, Me | 1.65, s | 123.9, CH | 5.39, br t (7.2) | 108.6, CH | 6.21, dd (8.4, 2.4) |
| 18 | 18.6, Me | 1.78, s | 132.7, C | 128.3, CH | 6.64, d (8.4) | |
| 19 | 26.6, Me | 1.65, s | 149.6, C | |||
| 20 | 18.9, Me | 1.87, s | 108.9, CH | 6.09, d (2.0) | ||
| 21 | 198.3, C | 159.1, C | ||||
| 22 | 54.0, CH2 | 3.28, 2.83, d (18.4) | 101.5, CH | 6.12, br t (2.0) | ||
| 23 | 78.3, C | 159.1, C | ||||
| 24 | 139.6, C | 108.9, CH | 6.09, d (2.0) | |||
| 25 | 25.9, Me | 2.18, s | 127.4, C | |||
| 26 | 118.6, CH2 | 5.04, 5.25, s | 157.3, C | |||
| 27 | 174.8, C | 103.7, CH | 6.35, d (2.4) | |||
| 28 | 157.5, C | |||||
| 29 | 107.1, CH | 6.09, dd (2.4, 8.4) | ||||
| 30 | 130.4, CH | 6.33, d (8.4) | ||||
| 1 0 | 115.7, C | |||||
| 2 0 | 161.6, C | |||||
| 3 0 | 109.3, CH | 6.67, d (2.4) | ||||
| 4 0 | 163.1, C | |||||
| 5 0 | 112.5, CH | 6.72, dd (8.8, 2.4) | ||||
| 6 0 | 131.7, CH | 7.92, d (8.8) | ||||
| OMe-27 | 54.0, Me | 3.73, s | ||||
| OH-1 | 12.95, br s | |||||
| OH-5 | 13.35, br s | |||||
| OH-23 | 5.52, br s |
The attached proton number of each carbon signal was verified by DEPT pulse sequence and confirmed by HMQC and HMBC 2D NMR spectra. a This signal was not identified in the HMQC spectrum; b These signals were overlapped in each column.
Table 2 1H (400 MHz) and 13C NMR (100 MHz) spectroscopic data of compounds 3–5.
| Position | 3 (acetone- d 6) | 4 (acetone- d 6) | 5 (chloroform- d 1) | |||
|---|---|---|---|---|---|---|
| δ C, mult. | δ H (J in Hz) | δ C, mult. | δ H (J in Hz) | δ C, mult. | δ H (J in Hz) | |
| 2 | 154.3, C | 154.1, C | 152.1, C | |||
| 3 | 107.6, CH | 6.62, s | 108.6, CH | 6.71, s | 107.5, CH | 6.61, s |
| 3a | 122.8, C | 122.8, C | 122.1, C | |||
| 4 | 122.3, CH | 7.42, d (8.4) | 122.3, CH | 7.42, d (8.4) | 121.1, CH | 7.39, d (8.4) |
| 5 | 113.4, CH | 6.82, dd (8.4, 2.0) | 113.5, CH | 6.80, dd (8.4, 2.0) | 111.9, CH | 6.77, dd (8.4, 2.0) |
| 6 | 156.8, C | 156.8, C | 153.4, C | |||
| 7 | 99.1, CH | 6.96, d (2.0) | 99.1, CH | 6.95, d (2.0) | 98.2, CH | 6.94, d (2.0) |
| 7a | 157.4, C | 157.4, C | 155.4, C | |||
| 8 | 27.8, CH2 | 3.14, d (7.2) | 27.9, CH2 | 3.15, m | 26.6, CH2 | 3.02-3.16, m |
| 9 | 125.4, CH | 5.05, br t (7.2) | 125.5, CH | 5.06, br t (7.2) | 123.1, CH | 5.01, br t (7.2) |
| 10 | 130.9, C | 130.9, C | 130.7, C | |||
| 11 | 18.4, Me | 1.37, s | 18.4, Me | 1.38, s | 17.6, Me | 1.38, s |
| 12 | 26.5, Me | 1.54, s | 26.5, Me | 1.54, s | 25.7, Me | 1.57, s |
| 13 | 24.4, CH2 | 2.42-2.47, m | 30.5, CH2 | 2.58, dd (13.6, 10.4) 2.74, dd (13.6, 2.4) | 79.4, CH | 4.04, s |
| 14 | 46.1, CH2 | 1.59-1.63, m | 77.9, CH | 3.59-3.63, m (10.4, 2.4) | 66.7, CH | 3.36, s |
| 15 | 70.8, C | 78.3, C | 56.8, C | |||
| 16 | 29.9, Me | 0.98, s | 21.3, Me | 0.93, s | 19.6, Me | 0.94, s |
| 17 | 29.9, Me | 0.98, s | 22.1, Me | 0.96, s | 24.8, Me | 1.18, s |
| 1 0 | 133.5, C | 134.5, C | 132.9, C | |||
| 2 0 | 123.8, C | 124.2, C | 124.0, C | |||
| 3 0 a | 157.8, C | 158.2, C | 158.2, C | |||
| 4 0 | 98.6, CH | 6.80, s | 98.7, CH | 6.82, s | 97.2, CH | 6.60, s |
| 5 0 a | 158.0, C | 158.5, C | 157.1, C | |||
| 6 0 | 125.6, C | 122.7, C | 119.7, C | |||
| OMe-13 | 57.0, Me | 3.36, s | ||||
| OMe-14 | 50.0, Me | 2.99, s | ||||
| OMe-3 0 b | 56.8, Me | 3.90, s | 56.9, Me | 3.90, s | 56.1, Me | 3.88, s |
| OMe-5 0 b | 56.8, Me | 3.91, s | 57.0, Me | 3.91, s | 55.7, Me | 3.88, s |
| OH-6 | 8.50, br s | 8.50, br s |
The attached proton number of each carbon signal was verified by DEPT pulse sequence and confirmed by HMQC and HMBC 2D NMR spectra. a,b These values in each column may be interchanged.
Table 3 Antioxidant activities and mushroom tyrosinase inhibitory effect of compounds from A. xanthocarpus. a
| Compounds | SC (µM)b 50 | IC (µM)b 50 | ||
|---|---|---|---|---|
| DPPH | ABTS +. | O —. 2 | Tyrosinase | |
| 1 | >300 | >300 | >300 | 59.3 ± 3.7 |
| 2 | >300 | >300 | nd | nd |
| 3 | 139.3 ± 6.2 | >300 | 67.2 ± 8.2 | 97.5 ± 1.5 |
| 4 | 140.4 ± 1.7 | 83.5 ± 5.8 | 49.2 ± 3.3 | 135.3 ± 6.4 |
| 5 | nd | nd | nd | nd |
| 6 | 28.7 ± 1.2 | 7.6 ± 0.1 | nd | 5.7 ± 0.3 |
| 7 | >300 | 55.0 ± 8.2 | 71.0 ± 4.0 | 85.8 ± 0.1 |
| 8 | 47.6 ± 12.7 | >300 | >300 | nd |
| 9 | 64.3 ± 8.0 | 6.5 ± 0.9 | 63.3 ± 4.4 | 6.4 ± 0.3 |
| 10 | 99.7 ± 2.8 | 22.7 ± 0.6 | 11.1 ± 0.5 | 247.3 ± 1.5 |
| 11 | >300 | >300 | nd | 1.9 ± 0.1 |
| 12 | >300 | >300 | >300 | 0.9 ± 0.1 |
| 13 | >300 | 286.1 ± 15.2 | nd | nd |
| 14 | >300 | 28.0 ± 1.7 | 93.6 ± 5.8 | 75.0 ± 4.1 |
| 15 | >300 | >300 | nd | 167.6 ± 5.2 |
| 16 | >300 | >300 | nd | 58.2 ± 5.1 |
| 17 | >300 | >300 | 63.9 ± 1.9 | 40.8 ± 1.9 |
| 18 | 18.7 ± 5.5 | 60.5 ± 0.1 | nd | nd |
| 19 | 86.9 ± 3.3 | 50.1 ± 2.2 | 102.1 ± 6.2 | 4.9 ± 0.3 |
| 20 | 47.7 ± 3.9 | 28.8 ± 0.6 | 90.8 ± 0.4 | 1.0 ± 0.5 |
| 21 | 38.7 ± 3.0 | 34.0 ± 0.6 | 220.2 ± 9.7 | 2.5 ± 0.4 |
| 22 | >300 | 101.9 ± 4.0 | 151.0 ± 10.4 | 239.4 ± 8.4 |
| Ascorbic acid c | 19.9 ± 1.2 | 28.2 ± 0.4 | 20.6 ± 1.6 | 105.0 ± 3.7 |
| Arbutin c | nd | nd | nd | 81.8 ± 2.3 |
| Kojic acid c | nd | nd | nd | 63.7 ± 4.5 |
Nd: not determined.
a The purity of each tested compounds was À 98% according to LC-MS data. Each value represents the mean ± S.D. of three independent experiments.
b SC is the concentration of the compounds required to scavenge 50% of the radicals; IC is the concentration of the compounds required to inhibit 50% of the enzyme; 50 50 nd: not determined due to poor solubility or limited yield.
c Ascorbic acid (vitamin C) is used as positive control of both free radical scavenger and tyrosinase inhibitor and, however, arbutin as well as kojic acid are used as positive controls of tyrosinase inhibitor.
Table 4 Effect of compounds isolated from A. xanthocarpus on melanin content, tyrosinase activity, and cell viability of B16F10 melanoma cells.
| Compounds | Concentration (µµ) | Cell viability (% of control) a | Melanin content (% of control)b | Tyrosinase activity (% of control)b |
|---|---|---|---|---|
| Control | 100.0 ± 0.9 | 100.0 ± 3.1 | 100.0 ± 3.0 | |
| OE- MSH | nd | 123.3 ± 10.5 # | 122.1 ± 12.3 # | |
| 1 | 40 | 110.1 ± 3.7 | 63.2 ± 9.4 ⁄⁄ | 78.7 ± 13.9 ⁄⁄ |
| 2 | 40 | 95.5 ± 4.3 | 50.8 ± 8.5 ⁄⁄ | 105.8 ± 4.9 ⁄⁄ |
| 3 | 10 | 105.1 ± 2.4 | 64.3 ± 9.4 ⁄⁄ | 111.7 ± 11.0 |
| 4 | 10 | 97.3 ± 0.4 | 65.7 ± 4.7 ⁄⁄ | 100.8 ± 6.4 ⁄ |
| 5 | nd | nd | nd | |
| 6 | 80 | 99.5 ± 7.8 | 113.9 ± 12.6 | 135.5 ± 3.0 |
| 7 | 80 | 97.9 ± 0.7 | 96.0 ± 9.6 ⁄ | 109.3 ± 18.4 |
| 8 | 20 | 102.0 ± 3.0 | 67.8 ± 111.6 ⁄⁄ | 86.6 ± 3.1 ⁄ |
| 9 | 80 | 102.4 ± 8.4 | 111.8 ± 10.9 | 134.3 ± 7.7 |
| 10 | 80 | 100.5 ± 0.4 | 100.0 ± 14.0 ⁄ | 176.5 ± 4.9 |
| 11 | nd | nd | nd | |
| 12 | 20 | 94.0 ± 1.3 | 112.6 ± 19.3 | 141.4 ± 12.2 ⁄ |
| 13 | 80 | 100.9 ± 5.3 | 134.9 ± 13.9 ⁄⁄ | 160.2 ± 38.5 |
| 14 | 20 | 106.7 ± 0.5 | 79.1 ± 3.4 ⁄ | 122.9 ± 16.5 |
| 15 | 10 | 75.2 ± 9.5# | nd | nd |
| 16 | 20 | 104.4 ± 8.6 | 92.6 ± 8.2 ⁄⁄ | 120.2 ± 11.2 |
| 17 | 10 | 107.0 ± 11.0 | 75.9 ± 3.5 ⁄⁄ | 75.6 ± 7.2 ⁄⁄ |
| 18 | 10 | 99.7 ± 1.9 | 72.0 ± 12.4 ⁄⁄ | 81.9 ± 11.9 ⁄⁄ |
| 19 | 40 | 99.7 ± 1.9 | 91.8 ± 7.8 ⁄⁄ | 91.0 ± 10.8 ⁄ |
| 20 | 80 | 103.4 ± 7.2 | 90.6 ± 3.5 ⁄⁄ | 144.3 ± 4.8 ⁄ |
| 21 | 40 | 95.2 ± 3.4 | 64.6 ± 8.9 ⁄⁄ | 72.2 ± 7.5 ⁄⁄ |
| 22 | 80 | 98.5 ± 1.6 | 108.5 ± 12.4 | 118.1 ± 11.3 |
| Arbutin c | 300 | 100.4 ± 0.7 | 76.4 ± 6.3 ⁄⁄ | 73.8 ± 5.4 ⁄⁄ |
| Kojic acid c | 300 | 98.9 ± 1.1 | 85.8 ± 6.8 ⁄⁄ | 81.1 ± 13.7⁄⁄ |
Nd: not determined due to being inactive in mushroom tyrosinase inhibition or limited yield. Data represents the mean ± S.D. (n = 3–6). (#) <0.05 indicates significant differences from the control group. (⁄) <0.05, ⁄⁄ p <0.01 indicates significant differences from the OE- MSH treated group.
a Effect of compounds on cell viability of B16F10 melanoma cells.
b The inhibitory effect on melanin production and tyrosinase activity in B16F10 melanoma cells stimulated by 50 nM OE- MSH.
c Positive control.
Table 5 Effect of selected compounds on melanin content, tyrosinase activity, and cell viability in B16F10 melanoma cells.
| Compounds | Con. (µµ) | Cell viability (% of control)a | Melanin content (% of control)b | Tyrosinase activity (% of control)b |
|---|---|---|---|---|
| Control | 100.0 ± 1.7 | 100.0 ± 2.5 | 100.0 ± 1.2 | |
| OE- MSH | nd | 121.1 ± 11.5 # | 120.5 ± 4.3 # | |
| 12 | 10 | 101.0 ± 1.7 | 105.7 ± 2.3 ⁄ | 137.2 ± 6.1 ⁄ |
| 16 | 10 | 93.9 ± 9.5 | 101.0 ± 8.0 ⁄ | 117.8 ± 8.5 |
| 17 | 10 | 107.0 ± 11.0 | 76.3 ± 2.9 ⁄ | 75.2 ± 8.8 ⁄ |
| 18 | 10 | 99.7 ± 1.9 | 70.8 ± 1.5 ⁄ | 88.7 ± 10.1 ⁄ |
| 19 | 40 | 99.7 ± 1.9 | 92.0 ± 15.2 ⁄ | 89.2 ± 6.8 ⁄ |
| 20 | 40 | 99.7 ± 9.4 | 107.4 ± 10.7 | 127.6 ± 3.6 |
| 21 | 40 | 95.2 ± 3.4 | 58.0 ± 2.2 ⁄ | 69.2 ± 4.0⁄ |
Nd: not determined. Data represents the mean ± S.D. (n = 3–6). (#) <0.05 indicates significant differences from the control group. (⁄) <0.05, ** p <0.01 indicates significant differences from the OE- MSH treated group.
a Effect of compounds on cell viability of B16F10 melanoma cells.
b The inhibitory effect on melanin production and tyrosinase activity in B16F10 melanoma cells stimulated by 50 nM OE- MSH.
| B |
Botanischer Garten und Botanisches Museum Berlin-Dahlem, Zentraleinrichtung der Freien Universitaet |
No known copyright restrictions apply. See Agosti, D., Egloff, W., 2009. Taxonomic information exchange and copyright: the Plazi approach. BMC Research Notes 2009, 2:53 for further explanation.