
Octodontomys gliroides (Woods & Kilpatrick, 2005)
|
publication ID |
https://doi.org/ 10.1111/zoj.12412 |
|
DOI |
https://doi.org/10.5281/zenodo.10543858 |
|
persistent identifier |
https://treatment.plazi.org/id/C37C6325-FFFA-8A4B-FCC6-FB8AFD9BFBB6 |
|
treatment provided by |
Marcus |
|
scientific name |
Octodontomys gliroides |
| status |
|
STRUCTURE OF OCTODONTOMYS GLIROIDES View in CoL
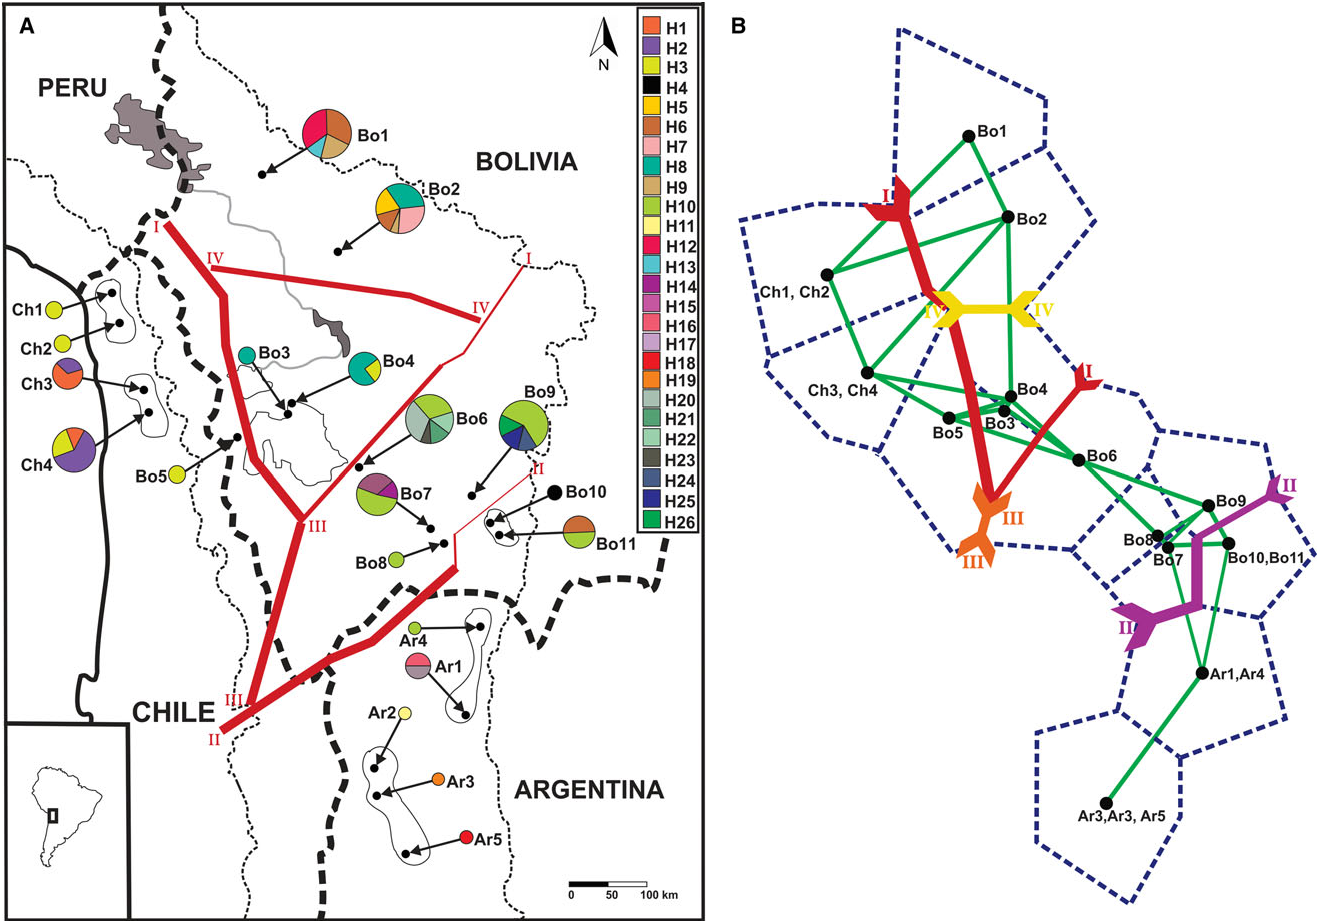
Our analyses of the mtDNA CR, supported by the phylogenetic and parsimony network analysis, showed a structured pattern of geographic differentiation within Octodontomys gliroides with the occurrence of two well-defined evolutionary lineages. Lineage A is restricted to Bolivia and Chile, and lineage B is restricted mainly to Argentina. This phylogeographic pattern was also described for other vertebrate species such as the South American mouse opossum Thylamys pallidior ( Thomas, 1902) ( Braun et al., 2005; Palma et al., 2014). Based on BARRIER analysis, a boundary (barrier II; Fig. 2A, B View Figure 2 ) was placed by the Monmomier’s algorithm, corroborating the separation of all Argentinian populations from the remaining Bolivian and Chilean populations with high bootstrap support. We observe that the upper end of this barrier separates the Bolivian populations Bo10 and Bo11 from the remaining populations, but with low bootstrap support ( Fig. 2A, B View Figure 2 ). This boundary corresponded to the San Juan River, which is the largest river in the eastern Andes and it is the principal tributary of the Pilcomayo River ( Fig. 5 View Figure 5 ). The San Juan River originates in the high mountains near Jujuy, Argentina, and flows from northern Argentina to south-west Bolivia through differing environments. Additionally, Argentinian populations are separated from the Chilean group by
Ʈ 2.688 2.248 2.783 index; Ɵ. 0.004. 0.01. 0.014 raggedness distribution SSD s n s 0.004... 0.019 n s.. s. s n.. 0.006 s. Harpending’s Mismatch r H 0.038 n n 0.107 0.029 n r;, H)
obs
diversity
B
F
and
A
<
F
P (
s 0.003 0.008 0.002
nucleotide
lineages Fu’s Fs 8.237 — 3.027 — 10.97; diversity
, π from F — sequences <D)
D
s obs. n. s. n. s. s n. haplotype
region D (P 0.347 0.353 0.245;, Hd control Tajima’s D 0.969 — 0.536 — 0.782 — sites DNA 0.0026 0.0027 0.0034 polymorphic mitochondrial on ƚ π SD 0.0043
0.01
ƚ 0.0038
0.09
ƚ
0.01
0.0059 ƚ S; haplotypes,. significant
based ƚ SD ƚ ƚ ƚ of non estimates S Hd 0.91 19 0.95 6 24 0.92, number.. n; s, diversity Genetic N Hap 93 20 6 7 100 26; Hap sequences squared deviations of of
4 Table
. Group Lineage A B Lineage TOTAL N, number sum, SSD
the occurrence of the Atacama Desert and by the high mountain ranges (> 4800 m a.s.l.) found at the border of Chile and Argentina (see barrier III; Figs 2A, B View Figure 2 and 5 View Figure 5 ) .
None of our analyses reproduced the different ecoregions where Octodontomys gliroides specimens were collected. Lineage A included individuals collected at the Andean Puna (northern, central, and southern Puna) and Andean pre-Puna. Lineage B included individuals from southern Andean Puna and Andean pre-Puna. Additionally, the genetic relationships among populations of Octodontomys gliroides increases with geographic distance, supporting an isolation by distance model, where the geographically close populations were characterized by low genetic differentiation, but when the distance among populations increased the genetic differentiation among populations also increased. In addition the comparison of N ST and G ST supported a phylogeographic structure in this species (N ST> GST), and our results further suggest that closely related haplotypes are often found in the same area. This pattern of population differentiation was also supported by the results of the AMOVA (P <0.001), which revealed that 73% of the overall mtDNA variation is accounted by differences between both lineages.
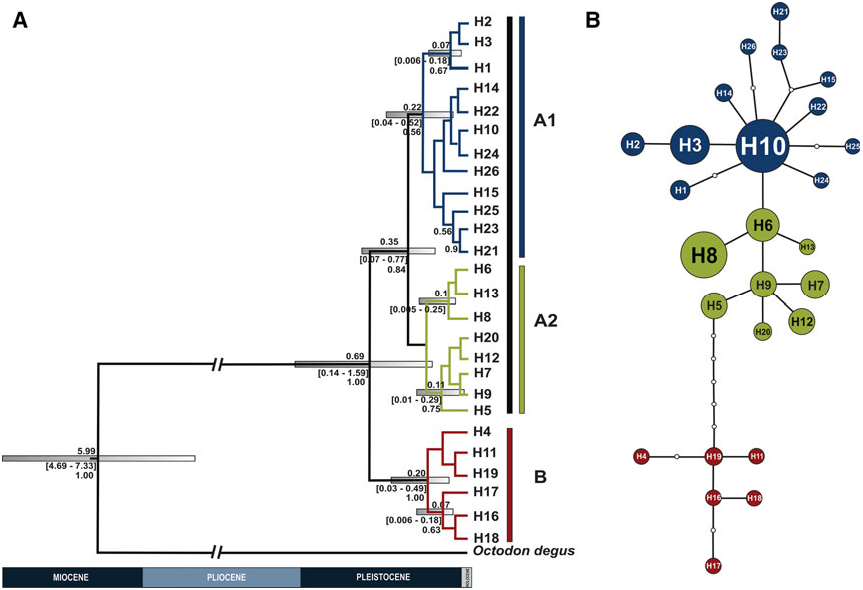
In turn, lineage A comprised two sublineages, A1 (widespread in northern Chile and in central and southern Bolivia) and A2 (restricted to northern and central Bolivia). This phylogenetic subdivision was supported by the parsimony network; however, this was very emergent separation because most haplotypes diverged in only one base pair ( Fig. 1B View Figure 1 ). Two boundaries, consisting of one major boundary between these sublineages and one additional boundary within these sublineages, were detected by BAR- RIER analysis. A major barrier (see barrier I; Fig. 2A, B View Figure 2 ) separated the Chilean populations and Bolivian population Bo5 from the remaining Bolivian populations. In turn, the most northern (Bo1 and Bo2) and two central (Bo3 and Bo4) Bolivian populations were separated from neighbouring Bolivian populations (Bo6 – Bo9). This separation is in agreement with the major barriers present in the area (i.e. major rivers, salt flats, the Atacama Desert, and the mountain chains of the Bolivian Andes). Lakes and river systems form an extensive endorheic basin constituted by the Titicaca and Poopo lakes, and by the Coipasa and Uyuni salt flats ( Fig. 5 View Figure 5 ). The major rivers connecting lakes and salt flats are the Desaguadero and the Lacajahuira. The Titicaca and the Poopo lakes are connected by the Desaguadero River that flows permanently, and the Lacajahuira River connects the Poopo Lake with the Coipasa salt flat ( Fig. 5 View Figure 5 ). The headwaters of these two permanent rivers increase during the wet season in the austral summer ( Roche et al., 1991). A critical characteristic of these two Andean rivers is that both are associated with large river – floodplain systems. In particular, the floodplain system of Desaguadero River undergoes strong floods when the water level increases in the Titicaca Lake, reaching a width of ~ 1 km. The floodplain is constituted by large sand deposits without vegetation, locally known as ‘arenales’. Thus an additional boundary, corresponding to these river systems, was detected between the most northern Bolivian populations (Bo1 and Bo2) and the central Bolivian populations (Bo3 and Bo4, see barrier IV; Fig. 2A, B View Figure 2 ). An additional barrier that may have contributed to separating the northernmost and central Bolivian populations from the southern Bolivian populations is the ‘Cordillera de los Frailes’, a mountain range that borders the Poopo Lake in the north-west, and extends in to the south in the north-east of the department of Potosi, Bolivia ( Montes de Oca, 2005; Fig. 5 View Figure 5 ). Even though the presence of barriers such as rivers, highlands, salt flats, and the Atacama Desert seem to have had an important role in shaping the genetic differentiation between haplotypes and populations of this rodent species. The geographical distances among populations seems to be the main factor in shaping the genetic structure of the Andean degu.
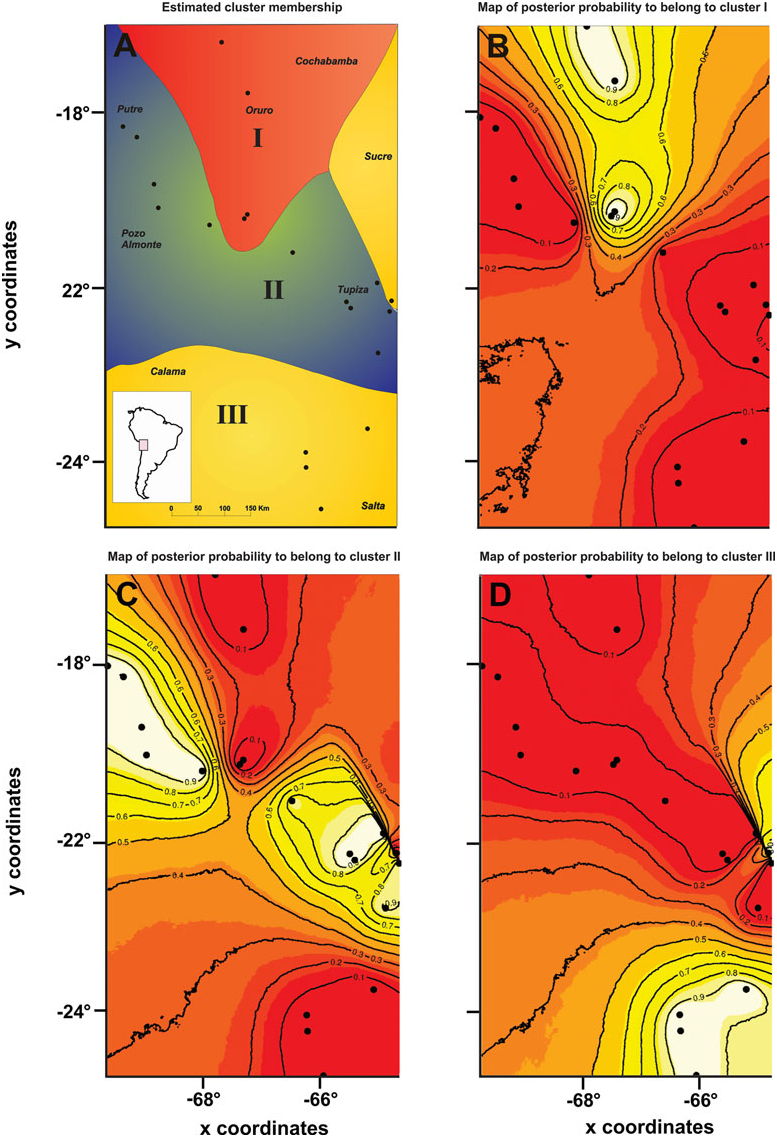
The GENELAND analysis recovered three genetic clusters ( Fig. 3A – D View Figure 3 ): (1) the northernmost and central Bolivian populations; (2) the Chilean populations, the central and southern Bolivian populations, and one Argentinian population; and (3) the remaining Argentinian populations and one southern Bolivian population. Cluster III exactly agreed with one of the lineages recognized in the phylogenetic and parsimony network analysis (lineage B). This cluster was separated from the other two clusters in the same area where Monmonier’s algorithm inferred the genetic barriers II and III to occur ( Fig. 2A, B View Figure 2 ). The other two genetic clusters corresponded to lineage A (more precisely the sublineages A1 and A2). The genetic break between both sublineages was approximately at the same area where Monmonier’s algorithm inferred the presence of barrier I ( Fig. 2A, B View Figure 2 ).
Calibration estimates derived from the mtDNA CR suggest that the time to the most recent common ancestor for Octodontomys gliroides and its sister species Octodon degus was during the Late Miocene, c. 5.99 Mya, which is close to the 6.07 Mya estimated by Opazo (2005) using the 12S rRNA gene; however, this calibration date is older than the 2.9 – 4.1 Mya reported by Honeycutt, Rowe & Gallardo (2003) using 12S rRNA and the nuclear growth hormone receptor (GHR) gene. In addition, our estimates agreed with those based on DNA hybrization (5.0 – 7.0 Mya; Gallardo & Kirsch, 2001). On the other hand, our results indicated that the diversification between the highly divergent lineages of the Octodontomys gliroides (lineage A and lineage B) occurred during the Middle Pleistocene 0.69 Mya, followed by further diversification events within each lineage ( Fig. 1A View Figure 1 ). The estimated diversification time for lineage A was found to be c. 0.350 Mya, followed by lineage B at 0.20 Mya. These calibration times for the Octodontomy s lineages are surprisingly low estimates given the records for other octodontid rodents: c. 1.47 Mya for Tympanoctomys barrerae ( Gallardo et al., 2013) and c. 1.25 Mya for Octodon degus ( Valladares, 2009) . Our estimate is not in disagreement with palaeontological data. In fact, this period agrees with a time of active orogenesis and substantial global climate fluctuations (i.e. dramatic oscillations in precipitation, see below) in the Andean region by the Late Pliocene – Pleistocene ( Placzek et al., 2009, 2011). These biogeographic events may have allowed the formation of new environments for the differentiation of local biota such as the Andean Altiplano (Puna) and the Atacama Desert ( Palma, Marquet & Boric-Bargetto, 2005; Lougheed et al., 2013; Alvarez- Varas, Gonzalez-Acu na ~ & Vianna, 2015). Our results are also concordant with examples of other vertebrate taxa that show similar diversification patterns: Andean passerine birds of the genus Phrygilus ( Alvarez-Varas et al., 2015) , the Rofous-collared sparrow Zonotrichia capensis (M uller €, 1776) ( Lougheed et al., 2013), and sigmodontine taxa of the genus Phyllotis ( Palma et al., 2005) , sculpted by changes associated with the geological and environmental history of the High Andes region during the Pleistocene, in particular with periods of contraction and expansion in what are known as palaeolakes (see below). Thus the ages presented in this paper can be regarded as rough estimations of diversification times for this species, which are now available for future comparisons and evaluation. Assessment of other mitochondrial and nuclear loci might corroborate the data presented in this study.

| SSD |
Sammlung Simon des Stattlichen Museum fur Mineralogie und Geologie Dresden |
No known copyright restrictions apply. See Agosti, D., Egloff, W., 2009. Taxonomic information exchange and copyright: the Plazi approach. BMC Research Notes 2009, 2:53 for further explanation.
|
Kingdom |
|
|
Phylum |
|
|
Class |
|
|
Order |
|
|
Family |
|
|
Genus |