Lestodon, Gervais, 1855
|
publication ID |
https://doi.org/10.37520/fi.2020.002 |
|
persistent identifier |
https://treatment.plazi.org/id/0397DC50-FF84-CD60-7E56-EC63DCD8FAF4 |
|
treatment provided by |
Diego |
|
scientific name |
Lestodon |
| status |
|
Lestodon armatus
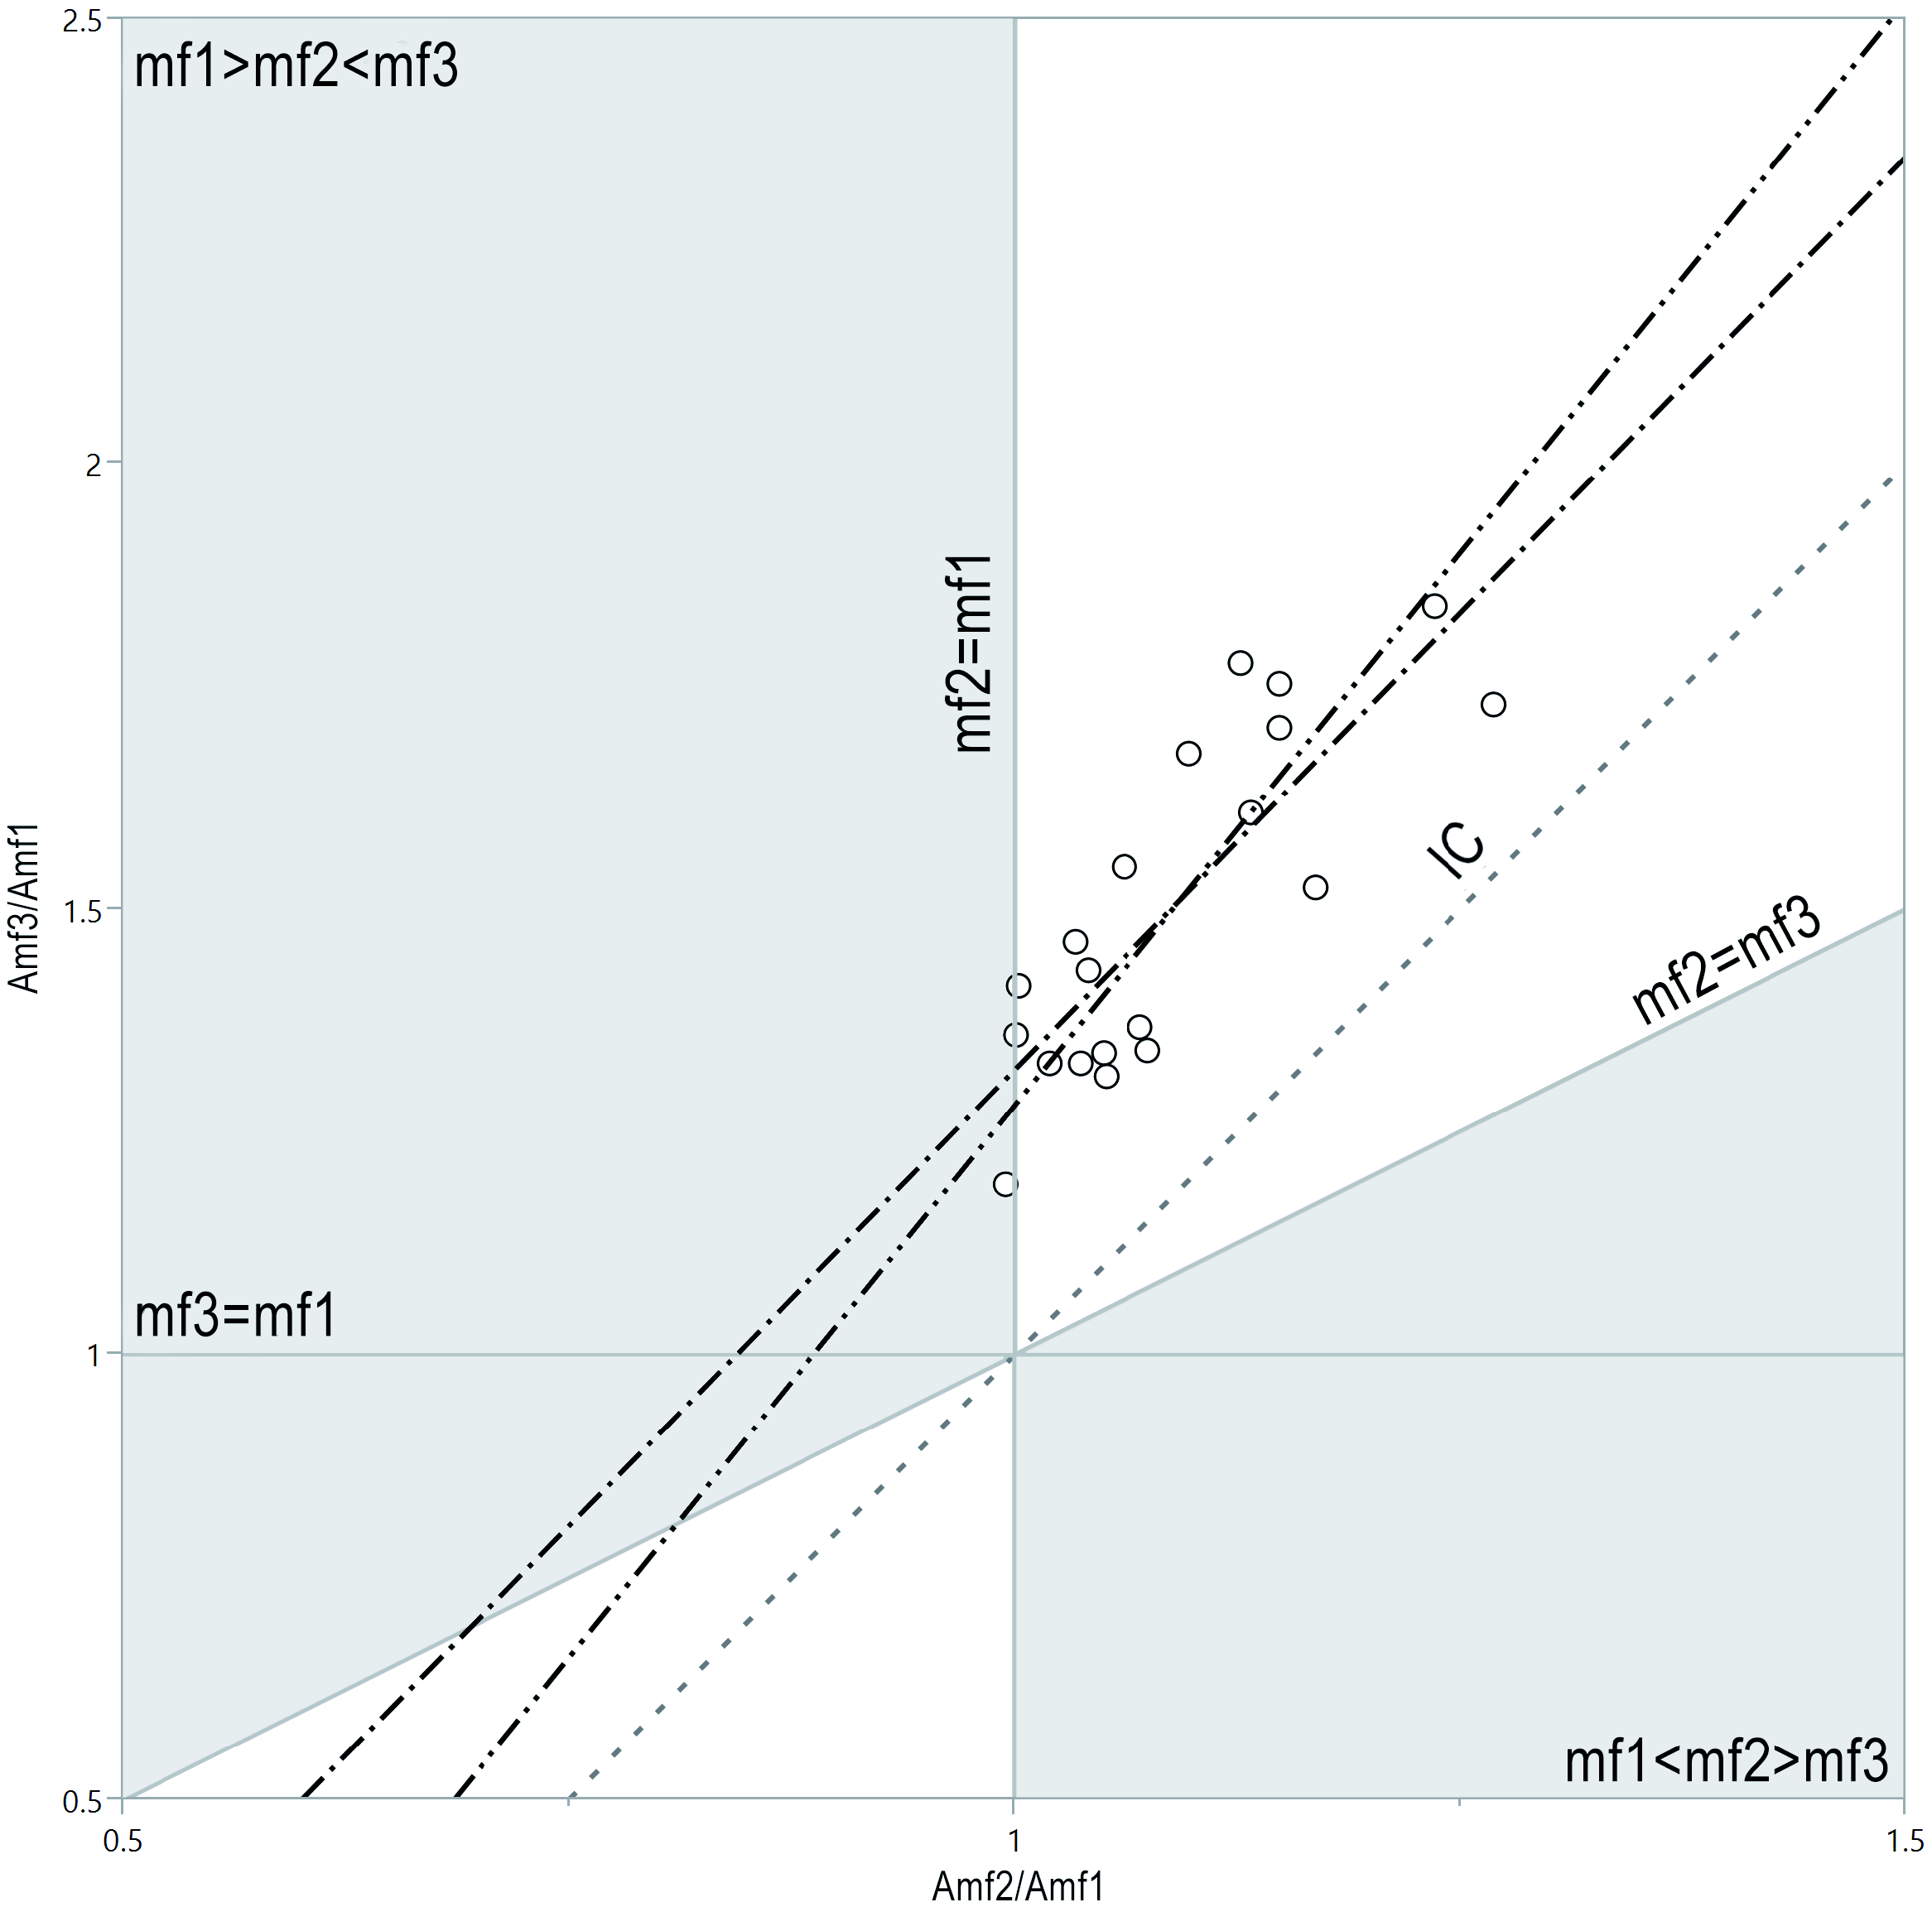
A significant positive correlation (r 2 = 0.66, p <0.01) was found between the ratios of mf2 and mf1, and mf3 and mf 1 in L. armatus. Regarding the IC model predictions, the regression analysis showed a slope of 2.05 (CI: 1.13–2.54) for OLS and 2.48 (CI: 1.38–3.05) for RMA, and an intercept of −0.73 (CI: −1.26–0.22) for OLS and −1.20 (CI: −1.82– 0.02) for RMA, consistent with the IC model ( Text-fig. 2 View Text-fig ). However, the results indicate that, even if L. armatus comply with the IC model, some specimens almost fall outside the strict IC model prediction, with mf1 and mf3 larger than mf2. When observing the different specimens of L. armatus in detail, it is evident that the mf3 is always the largest tooth (even in juvenile specimens), while mf1 and mf2 show more variability and overlap in their size ( Text-fig. 3 View Text-fig ). On the other hand, the mf2 occupied roughly 30 % on average among the studied individuals, well below the prediction of the IC model. Alternatively, considering the great variability in the caniniform size in this taxon, a preliminary test (data not shown) exploring the existence of an IC among the first three teeth with a lower sample showed a significant correlation and a slope of 1, clearly inconsistent with the IC model.
No known copyright restrictions apply. See Agosti, D., Egloff, W., 2009. Taxonomic information exchange and copyright: the Plazi approach. BMC Research Notes 2009, 2:53 for further explanation.


