
Scabiosa atropurpurea
|
publication ID |
https://doi.org/10.1016/j.phytochem.2022.113471 |
|
DOI |
https://doi.org/10.5281/zenodo.8169192 |
|
persistent identifier |
https://treatment.plazi.org/id/039ACE71-2C6F-6172-5331-FD8A168DBF7D |
|
treatment provided by |
Felipe |
|
scientific name |
Scabiosa atropurpurea |
| status |
|
2.1. LC-MS analysis of Scabiosa atropurpurea View in CoL methanol extract
To broaden the knowledge of the specialised metabolites occurring in S. atropurpurea , an in-depth phytochemical investigation has been developed in the present work. The methanol extract of S. atropurpurea was initially subjected to a preliminary analysis using an extremely sensitive analytical technique like liquid chromatography coupled with high-resolution tandem mass spectrometry in negative ionisation mode, using a mass spectrometer with an electrospray source coupled to an orbitrap mass analyser (LC-ESI/LTQOrbitrap/MS). The LC-MS profile ( Fig. 1 View Fig ), obtained using a mobile phase made up of a gradient of acetonitrile and water both acidified with 0.1% formic acid, highlighted the presence of 28 main chromatographic peaks corresponding to compounds belonging to the flavonoid, phenylpropanoid, and iridoid classes. Some of the main peaks were putatively attributed based on their accurate masses, characteristic fragmentation pattern, and by comparing the obtained results with data reported in literature and databases (database “KNApSAcK) on the Scabiosa species ( Table 1 View Table 1 ). Analysis of the LC-ESI/HR-MS n spectra of compounds 6–10, 12, 14 showed a typical fragmentation pattern with neutral losses of 132, 146, and 162 Da ascribable to flavones (apigenin, diosmetin, and luteolin) and flavonols (kaempferol and quercetin) glycosylated with sugar units corresponding to pentose, deoxyhexose and hexose units, respectively; in addition, a neutral loss of 120 Da corresponding to a C-linked hexose unit could be observed for compound 10. Compounds 4, 18, and 20 showed a typical fragmentation pattern observed for compounds belonging to the phenylpropanoid class. Tandem mass spectra of the [M-H] - ion at m/z 515 of compounds 18 and 20 showed an identical fragmentation to that reported in literature ( Clifford et al., 2005) for dicaffeoylquinic acid with a peak [M-caffeoyl-H] - at m/z 353, indicating the loss of a caffeoyl unit. Compounds 1–3, 5, 13, 15–17, 19, 21–28 showed an accurate mass ascribable to iridoid molecular formulae. In some cases, the fragmentation pattern of these compounds allowed us to ascertain the presence of sugar units linked to the aglycone moiety suggesting their structure as iridoid glycosides. In other cases, the fragmentation pattern, along with the molecular formula, suggested the occurrence of bis-iridoids which are made up of two iridoid moieties. They can be formed by dimerization of iridoids and secoiridoids. Based on this approach, it was not possible to assign the exact structure of all specialised metabolites, and it was also observed that some compounds, including 23, 25, and 28, exhibited accurate masses that were not traceable among compounds already reported in the literature for Scabiosa genus. With the aim to obtain an in-depth knowledge of the constituents of the methanol extract and unambiguously attribute the peaks occurring in the LC-MS profile, a phytochemical investigation of the extract was performed.
2.2. Isolation and characterisation of specialised metabolites from Scabiosa atropurpurea
The methanol extract of S. atropurpurea was fractionated by size exclusion chromatography through Sephadex LH-20. Then the fractions were further purified by HPLC-UV and RI, obtaining pure compounds whose structures were characterised by spectroscopic methods, including 1D- ( 1 H, 13 C, TOCSY) and 2D-NMR (DQF-COSY, HSQC, HMBC, and ROESY) experiments and ESI-MS analysis ( Benavides et al., 2006). All the isolated and identified metabolites are reported in Table 1 View Table 1 . The chemical investigation revealed that compounds 1, 4, 5, 7 – 9, and 15 were already reported in S. atropurpurea , while compounds 2 – 3, 12 – 14, 18, and 20 were reported in other species of the Scabiosa genus. Noteworthy, compounds 6, 10, 11, 16, 17, 19, 21–28 were found in S. atropurpurea for the first time, and among them, 23, 25, and 28 were undescribed compounds.
The molecular formula of compound 23 was established as C 18 H 28 O 11 by HR-ESI-MS ( m/z 419.1548 [M-H] -, calcd for C 18 H 27 O 11, 419.1553) and 13 C NMR data. The IR spectrum indicated the presence of OH ( 3340 cm 1) and C––O (1705 and 1635 cm _1). The MS/MS spectrum showed a principal product ion at m/z 239.09 [M-H-180] - originated by neutral loss of whole or mono-dehydrated hexose unit. The 1 H NMR spectrum of 23 showed signals for an olefinic proton at δ 7.44 (s), an acetal proton at δ 5.54 (1H, d, J =8.5 Hz), a hemiacetal proton at δ 4.53 (1H, d, J =5.9, 5.2 Hz), a terminal vinyl group at δ 5.30 (1H, d, J =10.5 Hz), 5.33 (1H, d, J =17.7 Hz) and 5.76 (1H, ddd, J =7.5, 10.5, 17.7 Hz). Further signals were observed at δ 1.67 (1H, ddd, J = 14.0, 5.2, 4.0), 2.10 (1H, ddd, J =14.0, 5.9, 1.5), 2.69 (1H, brdt J =8.5, 7.5) and 2.94 (m). From the COSY spectrum the sequence 4.53 (H-7), 2.10 (H-6a), 1.67 (H-6b), 2.94 (H-5), 2.69 (H-9), 5.76 (H-8), 5.33 (H-10a) and 5.30 (H-10 b) of a secoiridoid skeleton could be deduced. In addition, signals corresponding to two methoxyl groups at δ 3.72 (3H, s) and 3.32 (3H, s) could be observed. In the 1 H NMR spectrum, a signal corresponding to an anomeric proton at δ 4.71 (d, J =7.8 Hz) was present. The chemical shifts of all the individual protons of the sugar unit were ascertained from a combination of 1D-TOCSY and DQF-COSY spectral analysis, and the 13 C NMR chemical shifts of their attached carbons could be unambiguously assigned by HSQC (see Table 2 View Table 2 ) ( Gulcemal et al., 2012). These data demonstrated the presence of a terminal β- glucopyranosyl unit ( De Tommasi et al., 1998). A detailed analysis of 2D NMR experiments revealed that the structure of compound 23 was similar to that of secologanin-dimethyl-acetal ( Damtoft et al., 1995; Machida et al., 1995), except for the replacement of a methoxy group at C-7 with a hydroxy group. On this basis, compound 23 was identified as secologanin-methyl-hemiacetal, never reported before.
The molecular formula of compound 25 was established as C 48 H 60 O 15 by HR-ESI-MS ( m/z 875.3870 [M-H] -, calcd for C 48 H 59 O 15, 875.3854) and the 13 C NMR data. The IR spectrum indicated the presence of OH ( 3350 cm 1) and C––O (1705 and 1625 cm 1). The MS/ MS spectrum of this compound showed several main product ions: at m/ z 831.25 [M-H-44] -, 713.33 [M-H-162] - corresponding to the loss of one hexose unit, and others at m/z 495.21 [M-H-380] -, 459.29 [M-H-416] - and 503.38 [M-H-372] -, which only after characterisation by NMR could be attributed to the loss of a glycosidated iridoid moiety. The 1 H NMR spectrum showed characteristic signals for two olefinic protons at δ 7.47 and 7.45 (each, s), three acetal protons at δ 5.54 (1H, d, J = 8.5 Hz), δ 5.32 (1H, d, J = 8.5 Hz), and δ 4.60 (1H, dd, J = 5.9, 5.2 Hz), a secondary methyl group at δ 1.10 (3H, d, J =6.8 Hz), a terminal vinyl group at δ 5.30 (1H, d, J = 10.5 Hz), 5.35 (1H, d, J = 17.7 Hz) and 5.76 (1H, ddd, J = 7.5, 10.5, 17.7 Hz), and signals corresponding to one carbomethoxy group at δ 3.72 (3H, s). Moreover, signals corresponding to two butyloxy moieties at δ 3.63 and 3.44 (each 2H, m), 1.55 (4H, m), 1.42 (4H, m) and 0.97 (6H, t, J =7.4 Hz) were evident. The 1 H NMR spectrum showed for the sugar region signals corresponding to two anomeric protons at δ 4.70 (2H, d, J = 7.8 Hz). These data, in combination with 1D-TOCSY, HSQC, HMBC, DQF-COSY correlations, demonstrated the presence of two terminal β- glucopyranosyl units (see Table 2 View Table 2 ). All these results indicated the presence of an iridoid glucoside unit and a secoiridoid glucoside unit in the molecule (Kirmizibekmez et al., 2012); these spectroscopic features were similar to those of cantleyoside-dimethyl-acetal ( Gulcemal et al., 2010), except for the absence of two methoxyl groups. In the HMBC spectrum, the proton signals at δ 7.45 (H-3), 3.72 (-OCH 3), and 3.16 (H-5) showed long range correlations with the carbon resonance at δ 169.0 (C-11), while the proton signals at δ 3.44, 3.63 and 2.97 (H-5ꞌ) displayed long range correlations with the carbon resonance at δ 103.8 (C-7ꞌ), indicating the occurrence of the two butyloxy groups at C-7ꞌ. This linkage was also confirmed by the low-frequency shift of H-7ꞌ (δ 4.60) and C-7 (δ 103.8); these evidences suggested that compound 25 was made up of a loganin unit and a secologanin derived moiety ( Sohretoglu et al., 2013).
The site of linkage among the two units was confirmed by the HMBC experiment, which showed a strong correlation between the proton signals at δ 7.47 (H-3ꞌ), 5.24 (H-7), and 2.97 (H-5ꞌ) with the carbon resonance at δ 168.2 (C-11ꞌ). These data indicated that the carboxylic group (C-11ꞌ) of the secologanin derived moiety was linked to the C-7 hydroxyl group of the loganin unit. Therefore, compound 25 was established, as reported in Fig. 2 View Fig , and named atropurpurin A.
The molecular formula of compound 28 was established as C 45 H 54 O 15 by HR-ESI-MS ( m/z 833.3356 [M-H] -, calcd for C 45 H 53 O 15, 833.3387) and 13 C NMR data. Compound 28 differed from 25 for 42 uma (C 3 H 6). The MS/MS spectrum of this compound showed a main peak at m/z 671.26 [M-H-162] -, corresponding to the loss of a hexose unit and other main peaks at m/z 495.27 [M-H-338] - and 459.31 [M-H-374] -, that only after the NMR characterisation could be attributed to the loss of the iridoid unit. A comparison of 1 H NMR and 13 C NMR spectroscopic data of 25 and 28 revealed that 28 was structurally closely related to 25, with the replacement of a butyloxy moiety at C-7ꞌ with a methyloxy group (δ 3.33). Therefore, the structure of 28, named atropurpurin B, was determined, as reported in Fig. 2. View Fig
2.3. Evaluation of the total phenolic content and the antioxidant activity
Considering the occurrence of phenolic compounds in the extract, the phenolic content and the antioxidant activity of the methanol extract of Scabiosa atropurpurea were evaluated by spectrophotometric assays such as the Folin Ciocalteu assay and DPPH and TEAC tests ( Table 3 View Table 3 ). The total phenolic content of S. atropurpurea extract, expressed as gallic acid equivalents (GAE), corresponded to 7.60 mg of GAE/g of extract ( Santos et al., 2017). The TEAC value of the methanol extract, expressed as the concentration of the Trolox solution (mM) which has the same antioxidant activity as a 1 mg /mL solution of the tested extract ( Santos et al., 2017), was 0.28 mM. Quercetin 3- O -glucoside (TEAC = 0.663 mM) was used as the reference compound. The extract exhibited a concentration-dependent free radical scavenging activity expressed as EC 50, μg/mL of sample required to decrease the initial DPPH • concentration by 50% ( Cerulli et al., 2018), corresponding to 4.80 μg/mL, comparable to that exerted by vitamin C used as reference compound (4.40 μg/mL).
2.4. Anti-glucosidase activity
The extracts of S. atropurpurea and S. arenaria showed antihyperglycemic effects ( Bonet and Valles, 2007; Hlila et al., 2015). Moreover, iridoid compounds were reported to have antidiabetic effects ( Habtemariam, 2017; Wang et al., 2020). Genipin and geniposide displayed potential antidiabetic effects in vitro, and the iridoids loganin, previously isolated also from S. hymettia , S. atropurpurea , and S. variifolia was reported for its beneficial effect in the diabetic nephropathy control on in vivo studies involving mice with induced diabetes ( Habtemariam, 2017; Pinto et al., 2018). A recent report showed how the natural compound swertiamarin, isolated from S. hymettia , S. atropurpurea , and S. variifolia regulated the peroxisome proliferator-activated receptor gamma (PPAR-) and increased insulin sensitivity ( Habtemariam, 2017). Furthermore, it inhibited both α- amylase and α- glucosidase enzymes ( Pinto et al., 2018). Based on these observations, the methanol extract of S. atropurpurea and the main iridoids were tested for their ability to inhibit the α- glucosidase enzyme.
α- glucosidase is a carbohydrate-hydrolase located in the brush border cells of the intestine, which acts on the O -glucosidic α (1 → 4) linkage. The enzyme breaks down starch and glucose oligosaccharides into single α- glucose monosaccharides. Its inhibition reduces the digestion rate of carbohydrates, which are not broken down into glucose molecules, reducing glucose levels in the blood. Therefore, the α- glucosidase inhibitors represent a class of drugs used to control the glycemic level in non-insulin-dependent diabetes mellitus ( type 2), particularly postprandial hyperglycemia. The result is a delay in the digestion of carbohydrates, which delays the passage of the circulating glucose to allow pancreatic β cells to increase insulin secretion, reducing the postprandial glycemic peak ( Masullo et al., 2022).
The methanol extract of Scabiosa atropurpurea showed a potent inhibitory activity of α- glucosidase (value IC 50 = 100 μg/mL) comparable to that exerted by acarbose (value IC 50 = 175 μM), used as a positive control. The result obtained encouraged the evaluation of this activity also for eleven iridoids, isolated in higher amounts, including compounds 3, 5, 15, 16, 19, 23–28. All compounds showed IC 50 values (in the range of 25.01–92.59 μM) lower than that observed for acarbose ( Table 4 View Table 4 ). For compound 16, the IC 50 value was 25.01 μM, seven times lower than that exhibited by acarbose. Also, compounds 5 and 15 showed low IC 50 values (27.50 μM and 30.20 μM, respectively). Therefore, these results suggested to investigate this extract and individual iridoids as potential active principles in the treatment of diabetes.
2.5. Molecular docking experiments
Starting from the promising inhibitory activities detected for the tested iridoids against α- glucosidase from Saccharomyces cerevisiae , in silico studies were performed to shed light on the molecular basis responsible for the ligand/protein interactions. In this context, we recently reported a Saccharomyces cerevisiae α- glucosidase model generated by homology modeling experiments (see Materials and Methods) ( Masullo et al., 2022) since the absence of experimentally determined protein structure. Molecular docking experiments were then performed, focusing on the protein region involved in the catalytic activity of this enzyme that includes D214, E276, D349 ( Jenis et al., 2019; Yamamoto et al., 2010), also accounted in previous studies ( Jabeen et al., 2016; Ma et al., 2015; Milella et al., 2016; Wang et al., 2017).
Docking poses of active compounds 3, 5, 15, 16, 19, 23–28 (Glide software) ( Friesner et al., 2004, 2006; Glide, 2021; Halgren et al., 2004) were visually inspected in order to detect the ability of the tested compounds to establish an interaction pattern with the above reported key residues consistently with the observed biological activity ( Ma et al., 2015; Wang et al., 2017). Specifically, all the output poses related to the screened compounds were filtered providing that one contact with D214 and/or E276 and/or D349 was established. As expected, such a condition was positively satisfied after this screening and interestingly, most of the compounds specifically featured a H-bond with at least one of these key residues, supporting the obtained biological data ( Table 4 View Table 4 ). As reported in Fig. 3 View Fig , selected poses for compounds 5, 15, and 16, showing the lowest IC 50 values, highlighted their ability to interact via H-bonds with E276. In particular, compound 5 was able to establish this key interaction through the carbonyl moiety of its lactone chemical functions, whereas 15 and 16 through their glucopyranosyl units. Also, a large set of contacts was detected with further residues (e.g., F157, F158, H239, E304, P309, R312, Q350) stabilising the ligand/protein binding; among them, compound 16 was also able to make an additional H-bond with E304 ( Fig. 3 View Fig ) ( Jenis et al., 2019) through the terminal hydroxy function on the secoiridoid moiety.
3. Conclusions
In this study, three previously undescribed iridoids ( 23, 25 and 28), with fourteen known iridoids, four known quinic acid derivatives and seven known flavonoids, were isolated and identified from S. atropurpurea . This investigation confirms how plants belonging to the Scabiosa genus represent a source of flavonoids and iridoids. Interestingly, iridoids here reported are mainly bis-iridoids ( 13, 15, 16, 17, 19 and 21–28), made up of one iridoid and one secoiridoid unit. From a literature search on the chemistry of Scabiosa spp. S. atropurpurea can be considered the largest source of bis-iridoids. Therefore, considering the α- glucosidase inhibitory activity reported for iridoids, eleven iridoids and bis-iridoids isolated from S. atropurpurea , including compounds 3, 5, 15, 16, 19, 23–28, were tested. In silico investigation based on molecular docking experiments were carried out to evaluate the feasibility of selected compounds to form the complex with α- glucosidase enzyme active site. In detail, the analysis of the binding modes was focused on evaluating the ability of the investigated compounds to interact with the key residues responsible for the catalytic activity of α- glucosidase. The obtained results suggest how the antihyperglycemic effects shown by S. atropurpurea could be correlated to the occurrence of iridoid compounds. This work highlights the possibility of promoting S. atropurpurea as a source of functional ingredients for the treatment of diabetes. Anyway, further studies are required to deeper address this point, as well as the possibility of exploring the use of these iridoids in this disease.
4. Experimental
4.1. General methods
Optical rotations were obtained on a Jasco 2000 polarimeter. IR spectra were measured on a FTIR IFS-48 spectrometer (Bruker, BioSpinGmBH, Rheinstetten, Germany). NMR experiments were acquired in methanol- d 4 (99.95%, Sigma-Aldrich, Milan, Italy) on a Bruker DRX-600 spectrometer (Bruker BioSpinGmBH, Rheinstetten, Germany) equipped with a Bruker 5 mm TCI CryoProbe at 300 K. Data processing were carried out with Topspin 3.2 software. The ROESY spectra were acquired with tmix = 400 ms. HPLC separations were carried out on a Waters system (Milford, USA) equipped with a R-401 A refractive index detector, a Symmetry Prep TM-C18 (78 × 300 mm, 7 μm). Semipreparative HPLC separations were carried out by using a Phenomenex C18 Synergy-Hydro-RP ( 250 mm × 10 mm, 10 μm) column on an Agilent 1260 Infinity system (Agilent Technologies, Palo Alto, CA, USA), equipped with a binary pump (G-1312C), and a UV detector (G-1314 B). The mobile phase consisted of solvent A ( H 2 O +0.1% formic acid) and solvent B ( CH 3 CN + 0.1% formic acid).
TLC was performed on silica gel F 254 (Macherey-Nagel Deltek, Naples, Italy) plates ( 20 cm × 10 cm) and mixtures of CHCl 3 – CH 3 OH– H 2 O (80:20:2, 70:30:3, 61:32:7) (VWR international PBI S. r.l., Milan, Italy) were used as mobile phases to obtain a separation distance of 80 mm. Detection was carried out by spraying cerium (IV) sulphate followed by heating at 100 ◦ C for 5 min. HR/ESI-MS data were acquired on an LTQ Orbitrap XL mass spectrometer (Thermo Fisher Scientific, San Josѐ, USA) operating in negative ion mode.
4.2. Plant material
Whole plants of Scabiosa atropurpurea L. subsp. maritima (L.) Arc. ( Caprifoliaceae ) were collected in Urla (GPS coordinates latitude: 38.327028, longitude: 26.774579), Izmir, Turkey, dried in the shade and grounded. A voucher specimen was deposited in the Herbarium of Science Faculty, Ege University, Izmir, Turkey ( EGE 40781 ). GoogleMaps
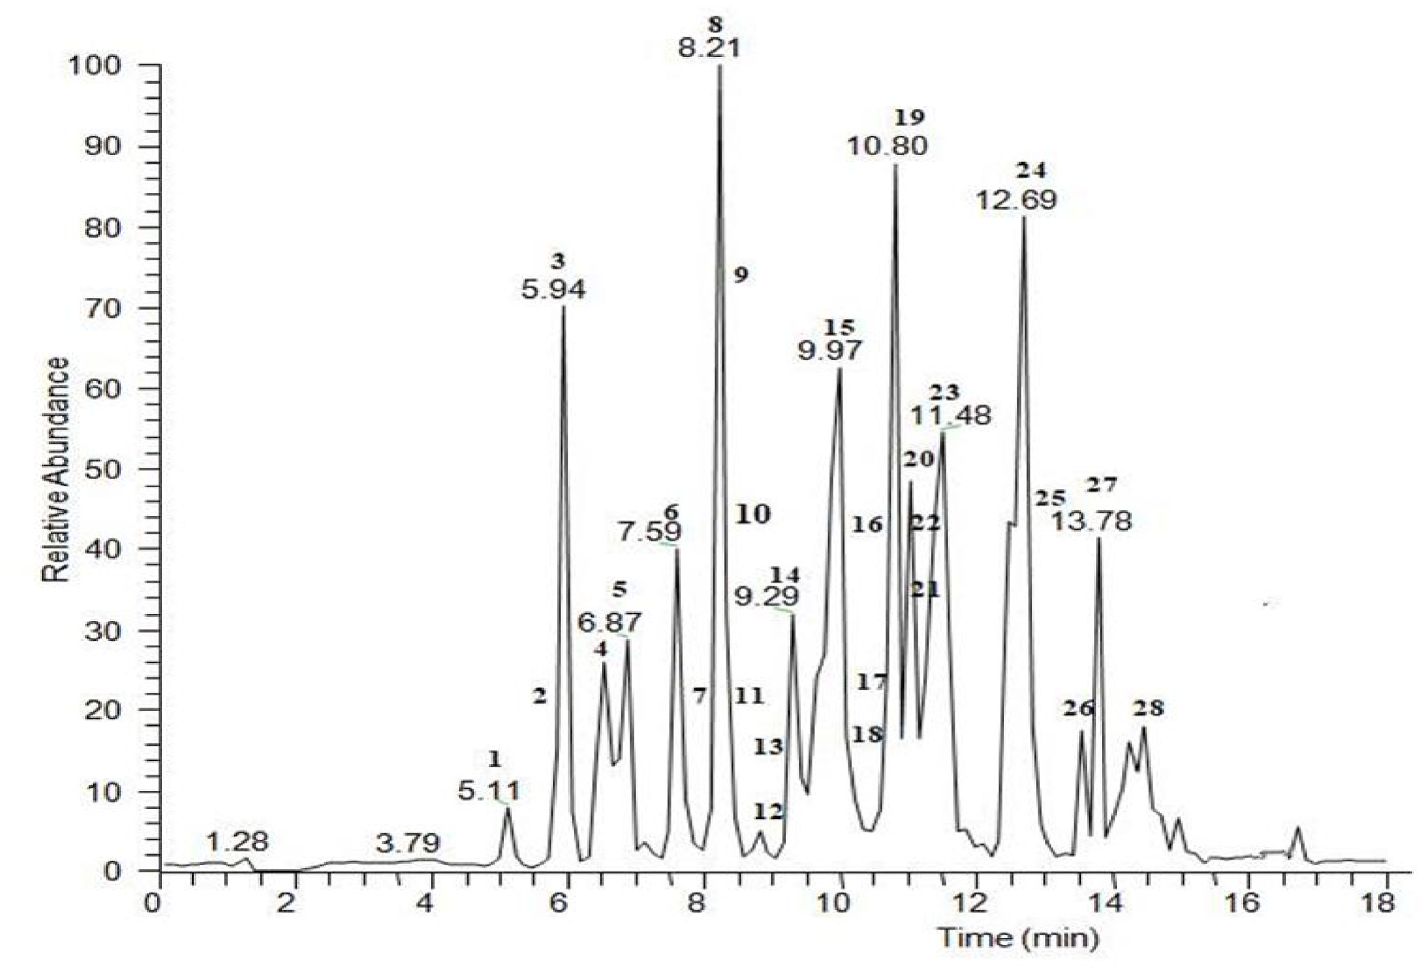
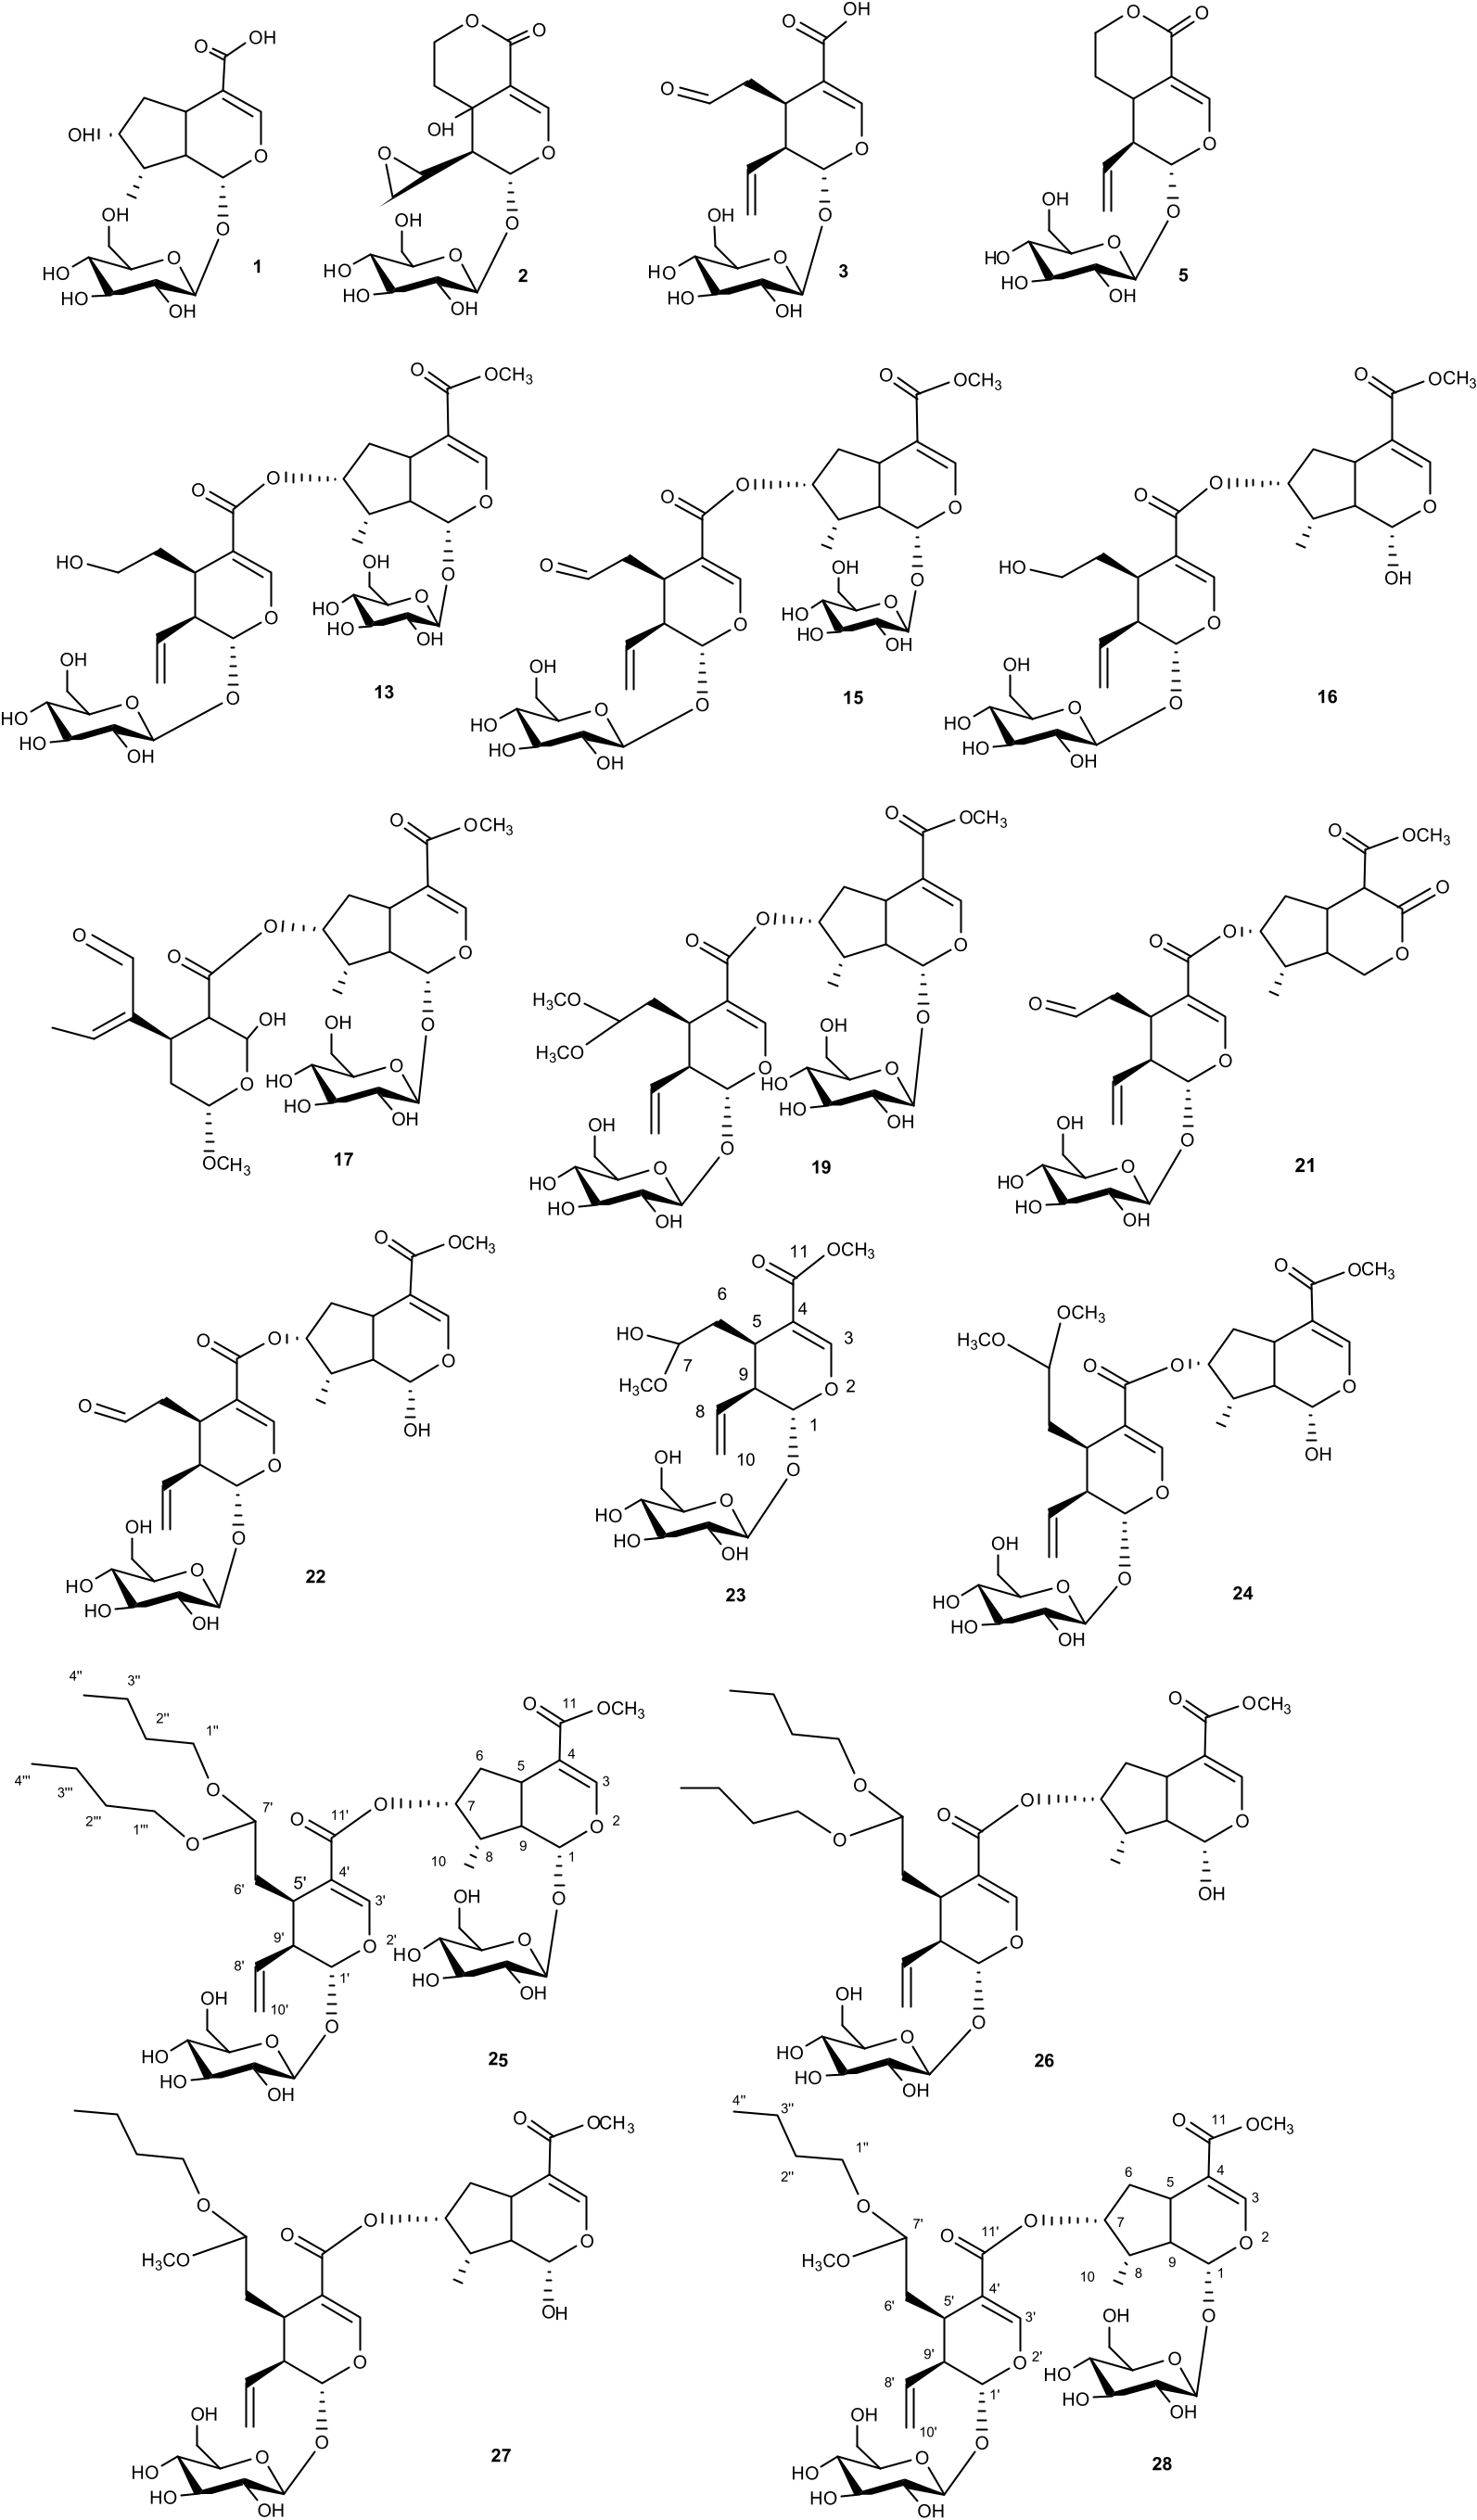
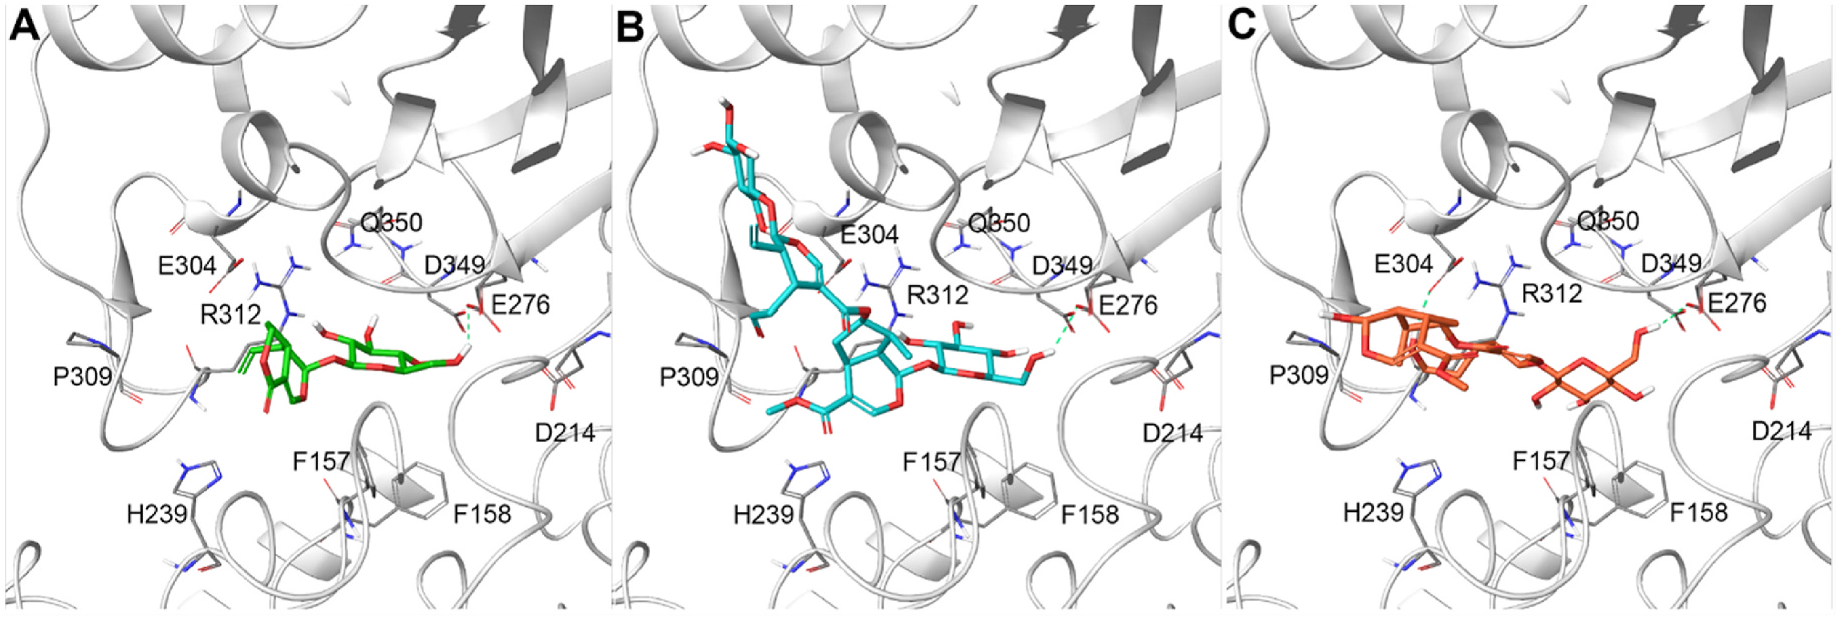
Table 2 1H and 13C NMR data (J in Hz) of compounds 23, 25 and 28 (CD OD, 600 MHz). 3
| 23 | 25 | 28 | ||||
|---|---|---|---|---|---|---|
| δC | δH | δC | δH | δC | δH | |
| 1 | 97.2 | 5.54, d (8.5) | 97.6 | 5.32, d (8.5) | 97.6 | 5.32, d (8.5) |
| 2 | – | – | ||||
| 3 | 153.0 | 7.44, s | 152.9 | 7.45, s | 152.9 | 7.45, s |
| 4 | 113.1 | – | 112.0 | – | 112.0 | – |
| 5 | 29.1 | 2.94, m | 33.0 | 3.16, td | 33.0 | 3.16, td |
| (8.0, 8.0, | (8.0, 8.0, | |||||
| 6.0) | 6.0) | |||||
| 6 | 33.0 | 2.10, ddd | 40.6 | 2.36, dd | 40.6 | 2.36, dd |
| (14.0, 5.9, | (14.0, 8.0) | (14.0, 8.0) | ||||
| 1.5) | 1.78, ddd | 1.78, ddd | ||||
| 1.67, ddd | (14.0, 6.0, | (14.0, 6.0, | ||||
| (14.0, 5.2, | 5.0) | 5.0) | ||||
| 4.0) | ||||||
| 7 | 103.8 | 4.53, dd | 78.9 | 5.24, br t | 78.9 | 5.24, br t |
| (5.9, 5.2) | (5.0) | (5.0) | ||||
| 8 | 135.7 | 5.76, ddd | 41.2 | 2.17, m | 41.2 | 2.17, m |
| (7.5, 10.5, | ||||||
| 17.7) | ||||||
| 9 | 44.3 | 2.69, brdt | 47.5 | 2.12, ddd | 47.5 | 2.12, ddd |
| (8.5, 7.5) | (10.8, 8.5, | (10.8, 8.5, | ||||
| 8.0) | 8.0) | |||||
| 10 | 120.0 | 5.33, | 13.4 | 1.10, d (6.8) | 13.4 | 1.10, d (6.8) |
| d (17.7) | ||||||
| 5.30, | ||||||
| d (10.5) | ||||||
| 11 | 168.2 | – | 169.0 | – | 169.0 | – |
| -OCH 3 | 51.8 | 3.72, s | 51.5 | 3.72, s | 51.5 | 3.72, s |
| 1’ | 97.2 | 5.54, d (8.5) | 97.2 | 5.54, d (8.5) | ||
| 2’ | ||||||
| 3’ | 153.4 | 7.47, s | 153.4 | 7.47, s | ||
| 4’ | 113.1 | – | 113.1 | – | ||
| 5’ | 29.5 | 2.97, m | 29.5 | 2.97, m | ||
| 6’ | 34.0 | 2.13, ddd | 34.0 | 2.13, ddd | ||
| (14.0, 6.3, | (14.0, 6.3, | |||||
| 1.5) | 1.5) | |||||
| 1.68, ddd | 1.68, ddd | |||||
| (14.0, 5.2, | (14.0, 5.2, | |||||
| 4.0) | 4.0) | |||||
| 7’ | 103.8 | 4.60, dd | 103.8 | 4.60, dd | ||
| (5.9, 5.2) | (5.9, 5.2) | |||||
| 8’ | 136.0 | 5.76, ddd | 136.0 | 5.76, ddd | ||
| (7.5, 10.5, | (7.5, 10.5, | |||||
| 17.7) | 17.7) | |||||
| 9’ | 45.5 | 2.71, brdt | 45.5 | 2.71, brdt | ||
| (8.5, 7.5) | (8.5, 7.5) | |||||
| 10’ | 120.0 | 5.35, | 120.0 | 5.35, | ||
| d (17.7) | d (17.7) | |||||
| 5.30, | 5.30, | |||||
| d (10.5) | d (10.5) | |||||
| 11’ | 168.2 | – | 168.2 | – | ||
| -OCH 3 | 53.2 | 3.32, s | 53.5 | 3.33, s | ||
| 1’’ | 67.0 | 3.63, m | 67.0 | 3.63, m | ||
| 3.44, m | 3.44, m | |||||
| 2’’ | 33.2 | 1.55, m | 33.2 | 1.55, m | ||
| (2 H) | (2 H) | |||||
| 3’’ | 20.8 | 1.42, m | 20.8 | 1.42, m | ||
| (2 H) | (2 H) | |||||
| 4’’ | 14.6 | 0.97, t (7.4, | 14.6 | 0.97, t (7.4, | ||
| 3 H) | 3 H) | |||||
| 1’’ꞌ | 67.0 | 3.63, m | ||||
| 3.45, m | ||||||
| 2’’ꞌ | 33.2 | 1.55, m | ||||
| (2 H) | ||||||
| 3’’ꞌ | 20.8 | 1.42, m | ||||
| (2 H) | ||||||
| 4’’ꞌ | 14.6 | 0.97, t (7.4, | ||||
| 3 H) | ||||||
| β- D-GlcI (at C-1) | β- D-GlcI (at C-1) | β- D-GlcI (at C-1) | ||||
| 1 | 99.7 | 4.71, d (7.8) | 100.3 | 4.70, d (7.8) | 100.3 | 4.70, d (7.8) |
| 2 | 74.3 | 3.22, dd | 74.9 | 3.21, dd | 74.9 | 3.21, dd |
| (7.8, 9.0) | (7.8, 9.0) | (7.8, 9.0) | ||||
| 3 | 78.8 | 78.4 | 78.4 | |||
Table 3 Total phenolic content and radical scavenging activity of S. atropurpurea methanol extract in DPPH and TEAC assays.
| Total Phenolic Content | DPPH • | ABTS •+ |
|---|---|---|
| GAE a SD d | EC b SD d 50 | TEAC c SD d |
| 7.60 ± 0.26 | 4.80 ± 0.06 | 0.28 ± 0.03 |
| a Values are expressed as gallic acid equivalents (GAE) mg/g of dried extract. | ||
| b Values are expressed as μg/mL. c Values are expressed as concentration (mM) of a standard Trolox solution | ||
| exerting the same antioxidant activity of a 1 mg/mL | solution of the tested | |
| extract. | ||
d Standard Deviation of three independent experiments.
Table 4 Antihyperglycemic activity of the main iridoids isolated from S. atropurpurea, expressed as IC50 (μM) value.
| Compounds | IC50 ± SD (μM) |
|---|---|
| 3 | 58.82 ± 2.08 |
| 5 | 27.50 ± 2.80 |
| 15 | 30.20 ± 2.13 |
| 16 | 25.01 ± 1.72 |
| 19 | 35.64 ± 1.18 |
| 23 | 49.95 ± 1.08 |
| 24 | 32.36 ± 2.06 |
| 25 | 86.96 ± 3.50 |
| 26 | 38.46 ± 2.08 |
| 27 | 82.01 ± 3.50 |
| 28 | 92.59 ± 3.52 |
| acarbose | 175.00 ± 3.50 |
| H |
University of Helsinki |
No known copyright restrictions apply. See Agosti, D., Egloff, W., 2009. Taxonomic information exchange and copyright: the Plazi approach. BMC Research Notes 2009, 2:53 for further explanation.
|
Kingdom |
|
|
Phylum |
|
|
Class |
|
|
Order |
|
|
Family |
|
|
Genus |