
Phytophthora cactorum, (Lebert & Cohn) J. Schrot (Lebert & Cohn) J. Schrot
|
publication ID |
https://doi.org/10.1016/j.phytochem.2021.112820 |
|
DOI |
https://doi.org/10.5281/zenodo.8270202 |
|
persistent identifier |
https://treatment.plazi.org/id/039F8798-BE29-FFBC-FCED-FCB8FE6AFF0C |
|
treatment provided by |
Felipe |
|
scientific name |
Phytophthora cactorum |
| status |
|
2.1. Overview of metabolic changes caused by P. cactorum View in CoL View at ENA inoculations
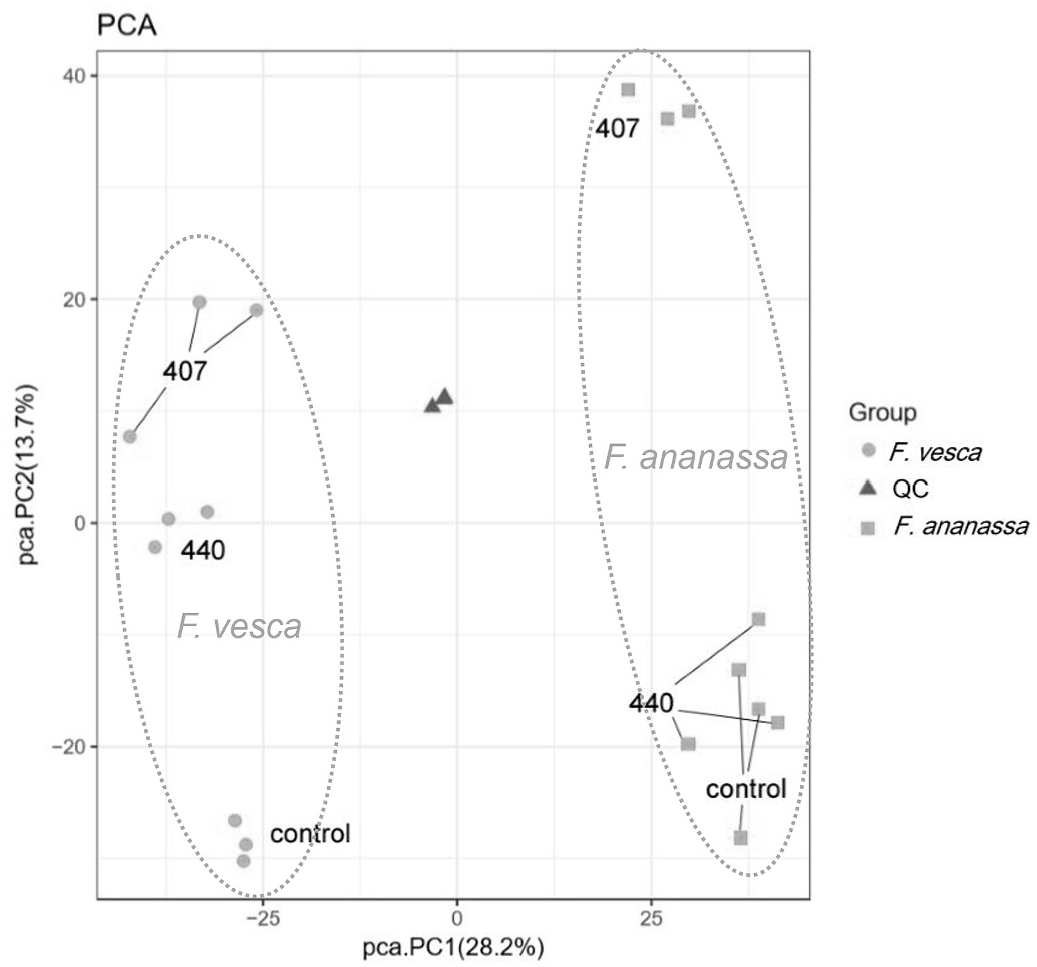
The metabolite analysis revealed 3952 molecular features from the crown samples. Based on the overall metabolite profiles of the samples, also illustrated by principal component analysis ( Fig. 1 View Fig ), Fragaria species is the predominant factor influencing the metabolite profiles. In F. × ananassa (cv. Senga Sengana), inoculation with the P. cactorum isolate Pc407 (Pc407-Fa) caused a clear separation in PC2 (squares), whereas the Pc440-inoculated samples (Pc440-Fa) clustered near to the controls (C-Fa). In F. vesca (accession Hawaii 4, clone H4.4), both P. cactorum isolates influenced the metabolite profiles (balls), although the differences were less pronounced than in the Pc407-Fa interaction. The biological replicates of C-Fv, Pc440-Fv, and Pc407-Fa, were tightly clustered within each of these groups, whereas clustering of Pc440-Fa, C-Fa, and Pc407-Fv samples was more loose in the PCA plot ( Fig. 1 View Fig ). This could be attributed to the size variation of the crown samples. The diameters of the crowns were not recorded, but biomass differences between the biological replicates were considerable, particularly among the Pc440-Fa and C-Fa samples (Table S1).
No known copyright restrictions apply. See Agosti, D., Egloff, W., 2009. Taxonomic information exchange and copyright: the Plazi approach. BMC Research Notes 2009, 2:53 for further explanation.
|
Kingdom |
|
|
Phylum |
|
|
Class |
|
|
Order |
|
|
Family |
|
|
Genus |