
Salmo trutta, Linnaeus, 1758
|
publication ID |
https://doi.org/10.1111/jfb.13772 |
|
DOI |
https://doi.org/10.5281/zenodo.10946252 |
|
persistent identifier |
https://treatment.plazi.org/id/03F187DC-FFCB-5151-FFF9-F96A8023E9B9 |
|
treatment provided by |
Felipe (2024-04-04 20:03:19, last updated 2024-04-08 19:32:21) |
|
scientific name |
Salmo trutta |
| status |
|
3 | RESULTS View in CoL
3.1 | Geometric morphometrics
The shape changes associated with the first three between-group principal components ( Figure 1 View FIGURE 1 (b)) cumulatively explained 76.9% of variance in the data ( Table 1 View TABLE 1 ). PC1 described enlargement of head height at length, whereas PC3 was most strongly associated with reduced head and body depth. PC2 was associated with dorso-ventral arching of the body and, as an artefact of positioning the flexible fish bodies for photographing, was removed mathematically before further analysis (see § 2.4.1). While individual loadings on PC1 described a progressive, age-related shape change from a larger to smaller head size ( Figure 2 View FIGURE 2 (a)), loadings on PC3 appeared to describe an increase in body depth of exercised as opposed to control groups in the later stages of the experiment ( Figure 2 View FIGURE 2 (a)). This was partly confirmed by the results from linear discriminant analysis (LDA): the coefficients from linear discriminants 1 and 2, cumulatively explaining 88.33% of variance in the data ( Table 1 View TABLE 1 ) were most strongly associated with PCs 1 and 3, respectively ( Table 2 View TABLE 2 ). LDA achieved 85.19% correct group classification and 62.96% cross-validated correct classification for treatment groups across weeks ( Figure 2 View FIGURE 2 (b) and Table 3 View TABLE 3 ). Between-group Mahalanobis distances and permutated T 2 tests ( Table S 2 in View TABLE 2 File S1) confirmed a clear group separation along the age axis (weeks under treatment), associated with a decrease in head height/depth relative to lateral body depth (LD1, PC1; Figure 2 View FIGURE 2 (b)). Although body depth appeared to be greater in the exercised as opposed to control groups towards the end of the experiment (LD2, PC3; Figure 2 View FIGURE 2 (b)), the difference between same-aged exercised and control groups was not statistically significant (p> 0.05; Table S 2 in View TABLE 2 File S1).
3.2 | Mass–length relationships and condition at length
A comparison of log mass-log length relationships for the exercised v. control cohorts did not reveal a significant difference in the slopes (F 1,43 = 0.21; p> 0.05) or intercepts dependent on treatment (F 1,43 = 0.65; p> 0.05). Cohort-specific regressions of M and L S with the C00 individuals (n = 6) as a common origin described a mass– length relationship in the form of M ¼ 0:0143 L 3:0242 for the exercised s cohort and M ¼ 0:0146 L 3:0044 for the control cohort ( Figure 3 View FIGURE 3 ). Theres fore, exercised individuals were slightly (albeit not significantly) heavier for their length as they grew larger (stronger positive deviation of b from the cubic 3) than control individuals. Consequently, condition-at-length, K, derived from the regression parameters for each cohort, differed across weeks (i.e., age; F 3,39 = 194.038, d.f. = 3, p <0.001) as well as treatments (F 1,39 = 864.99, d.f. = 1, p <0.001) ( Figure 4 View FIGURE 4 ). In addition, the pattern of variation in K across weeks differed between treatments as indicated by the statistically significant interaction term (F 3,39 = 85.803, d.f. = 3, p <0.001). Specifically, K was higher in exercised compared with control groups over the whole experimental period. Within treatments, K consistently increased for exercised individuals over the experimental period, while for control individuals, K only increased from week 4 to week 20, week 4 to week 32 and week 10 to week 32 ( Figure 4 View FIGURE 4 ).
3.3 | Caudal-fin size
A CF: L S 2 did not differ between treatments at 20 weeks (mean S.E.; exercised = 0.029 0.002, control = 0.028 0.002; t = 0.291, d. f. = 9.36, p> 0.05) or at 32 weeks (exercised = 0.024 0.001, control = 0.024 0.001; t = −0.147, d.f. = 8, p> 0.05) after treatment initiation. However, overall and irrespective of treatment, A CF: L S 2 ratios were significantly higher after 32 weeks compared with 20 weeks (Figure 5) since treatment initiation (20 weeks = 0.028 0.001, 32 weeks = 0.024 0.001; t = 2.999, d.f. = 14.778, p <0.01).
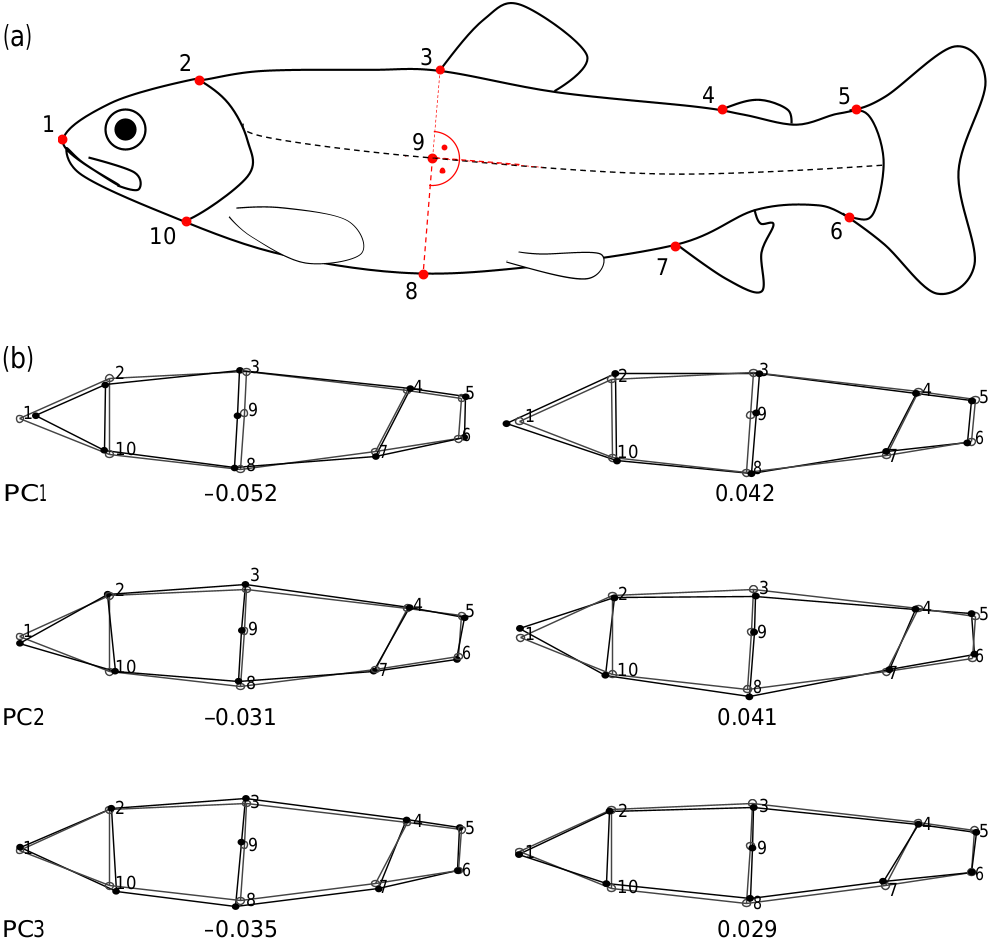
FIGURE 1 (a) Landmark positions () on Salmo trutta parr that were digitised twice and then averaged to minimize measurement error. (b) Shape changes associated with principal components (PCs) 1–3. PCs were derived from a between-group PC analysis of Procrustes superimposed landmarks., Consensus shape with numbered landmark positions;, Shape changes associated with each PC. Shape changes are scaled to observed PC scores: Left hand side shape changes (back outlines) are scaled to the minimum value observed across the sample on each respective PC (shown below the image) and right hand side shape changes (black outlines) are scaled to the maximum value observed across the sample on each respective PC. PC1 describes a change in head size, PC2 describes dorso-ventral arching of the body and PC3 describes changes in overall robustness and body depth
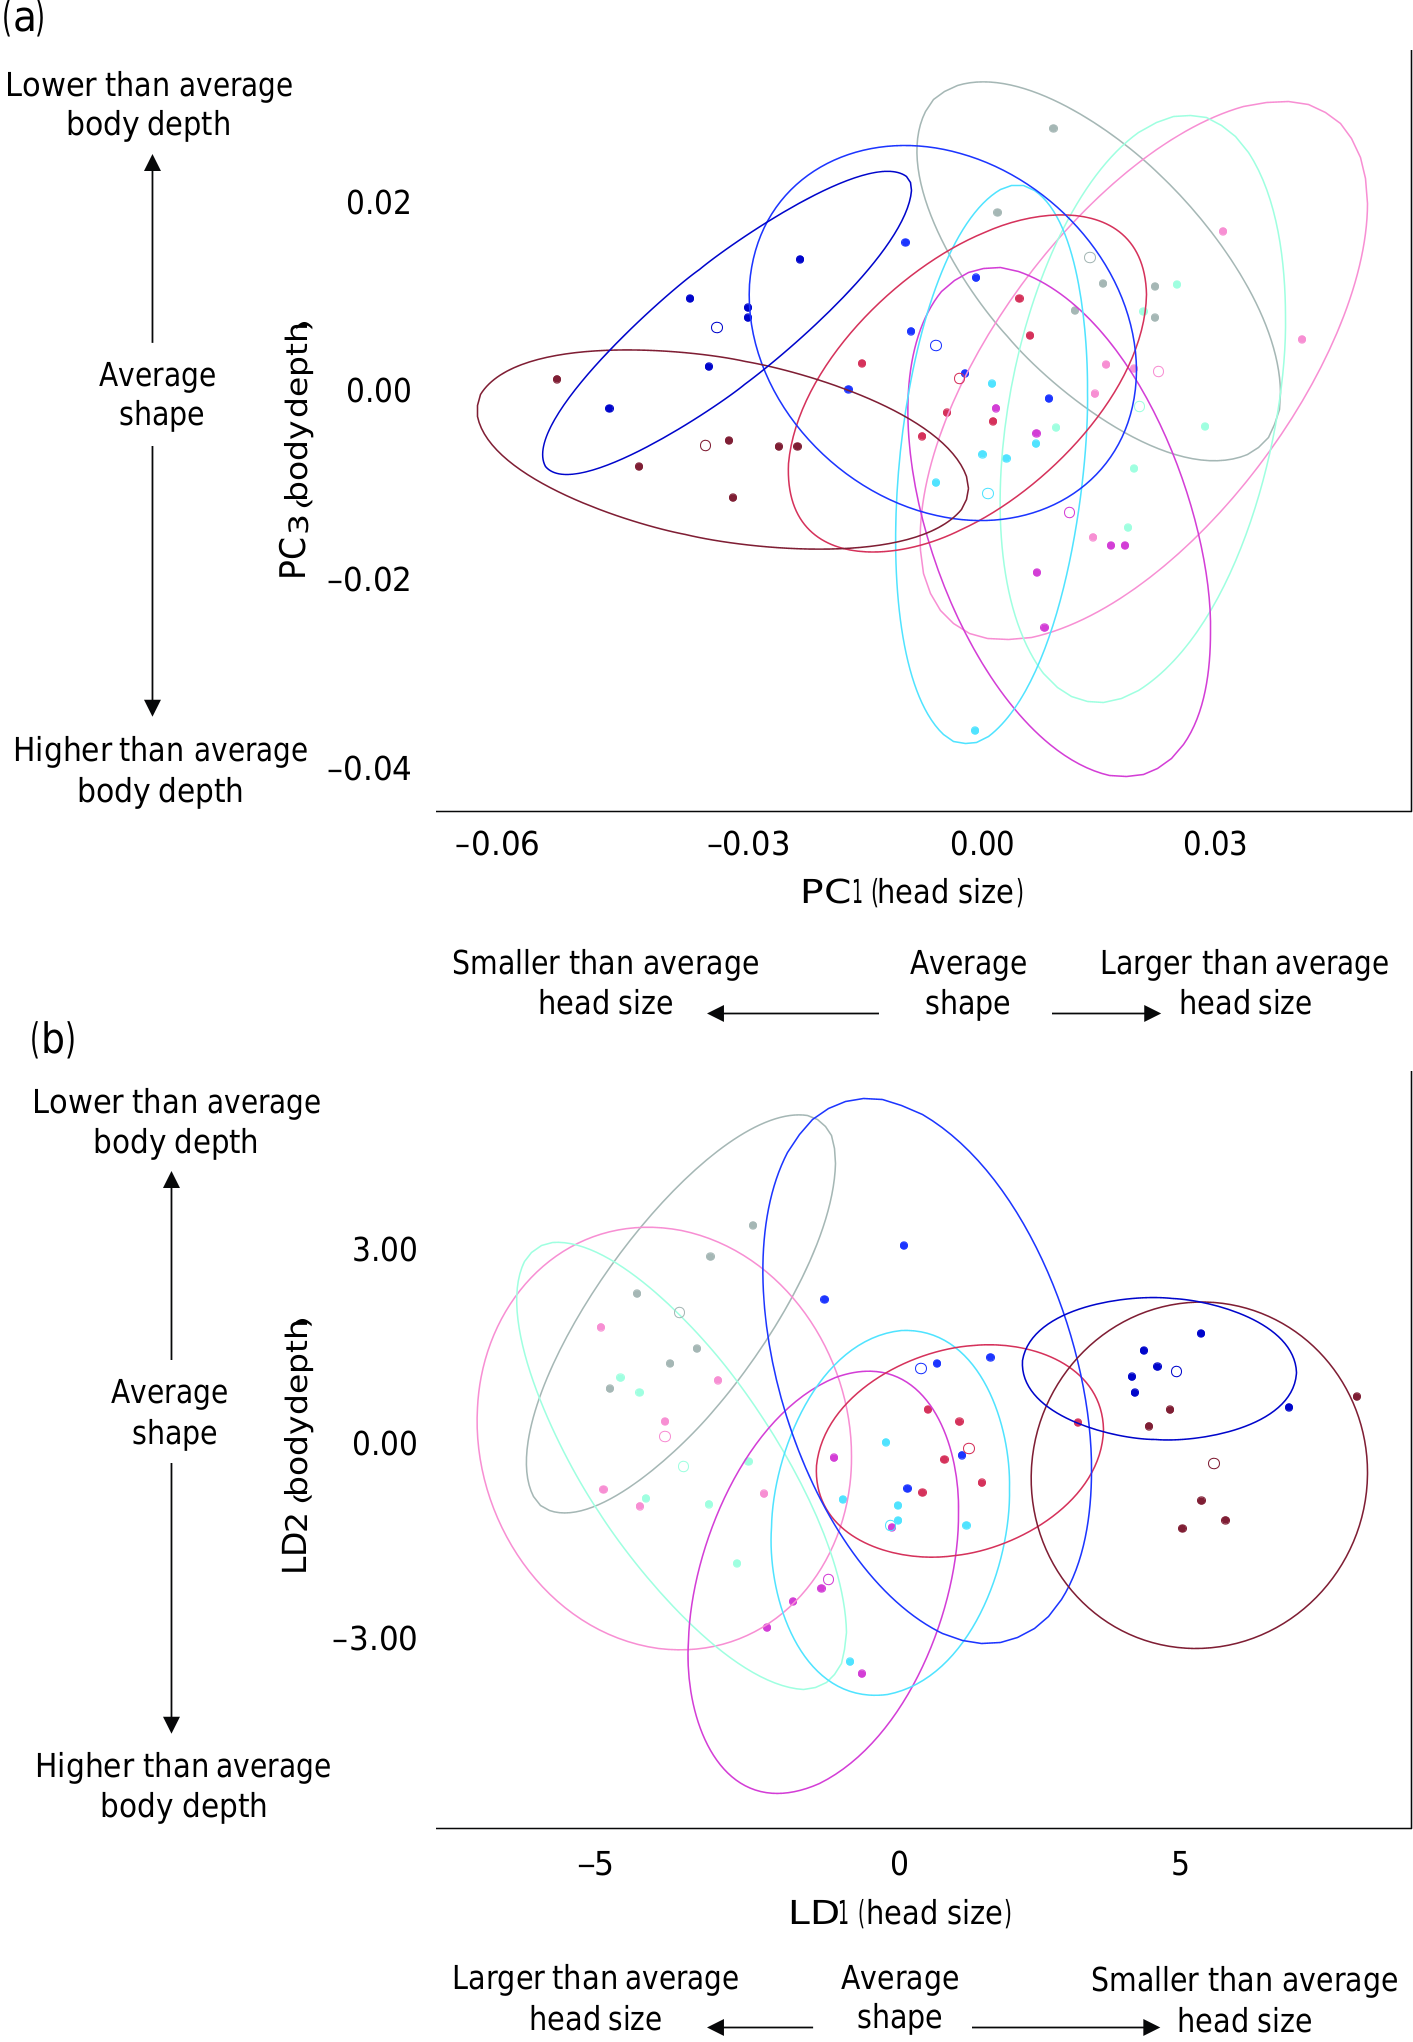
FIGURE 2 (a) Principal component (PC) () C00, () C04, () C10, () C20, () C32, () E04, () E10, () E20, and () E32 and (b) linear discriminant (LD) scores for Salmo trutta treatment groups (C, control; E, exercise) across experimental weeks (i.e., age 00 (control sample before treatment initiation) to 32 (32 weeks of treatment); n = 6 individuals per group). PC1 and PC3, derived from a between-group PC analysis of Procrustes superimposed landmarks corrected for the arching artefact (PC2). LD1 and LD2, derived from a LD analysis on the corrected principal component scores. Ellipses demarcate 95% confidence intervals; O, group centroids. N.B. The change of direction for head size on LD1 resulting from a negative association with PC1 (see Table 2)
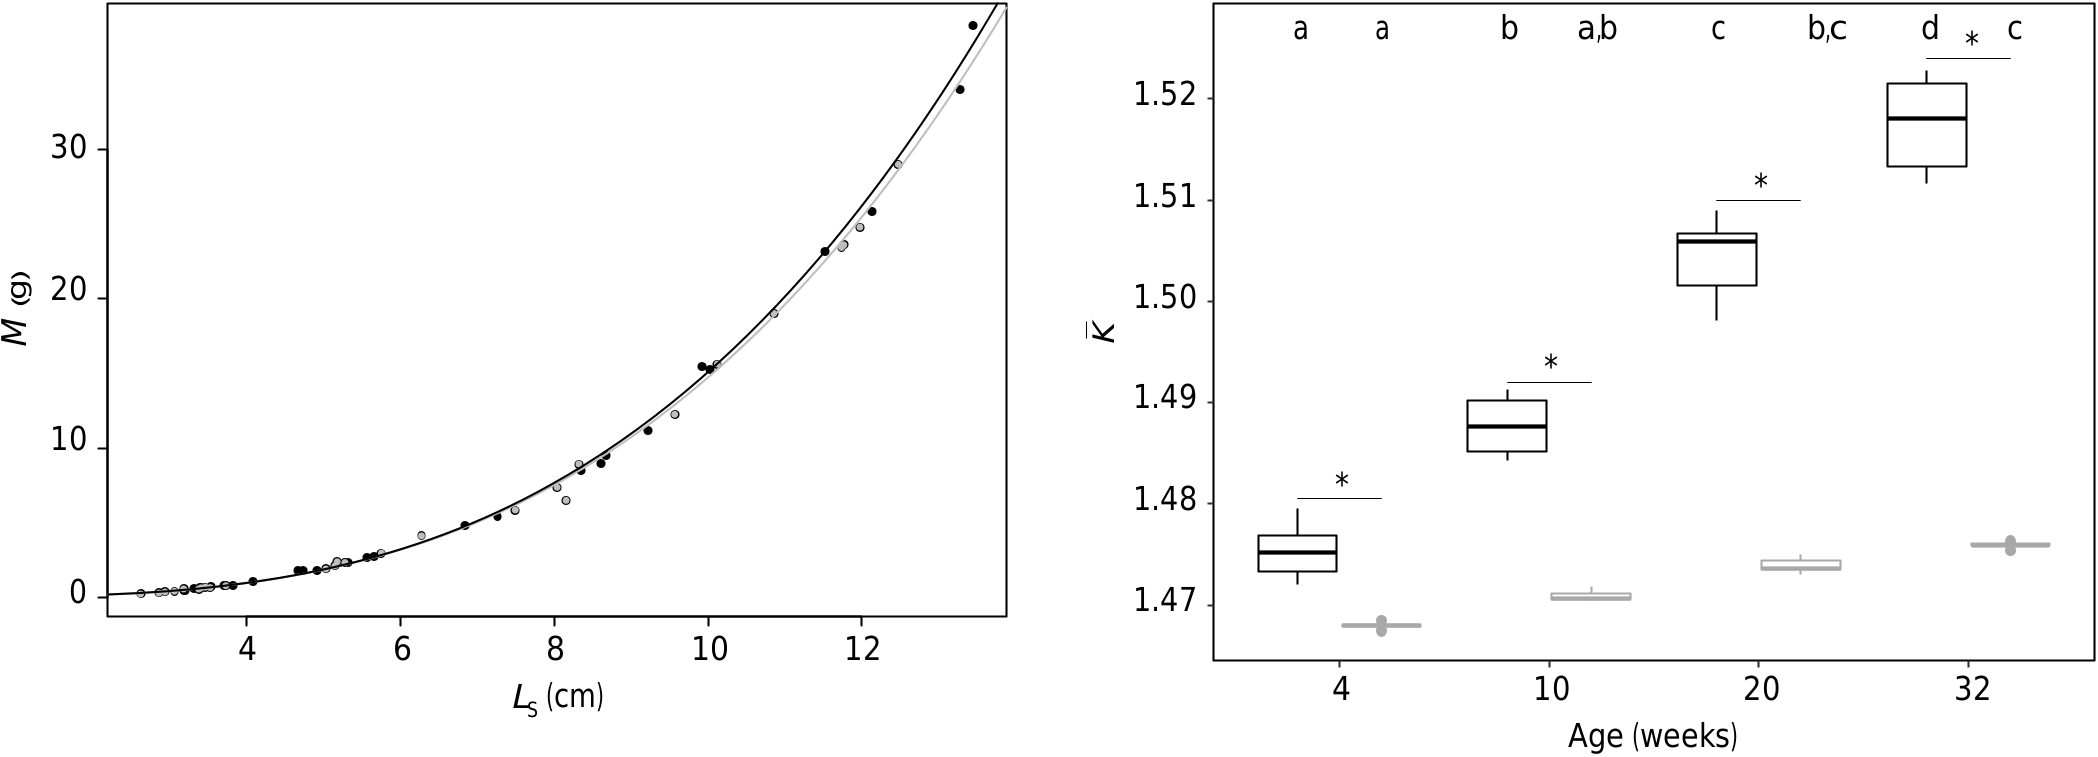
FIGURE 3 Mass–standard length (M–LS) relationships (MLR) determined for exercised () and control () Salmo trutta cohorts over 0–32 weeks from treatment initiation. Each cohort included LS00 individuals (n = 6) as a common origin
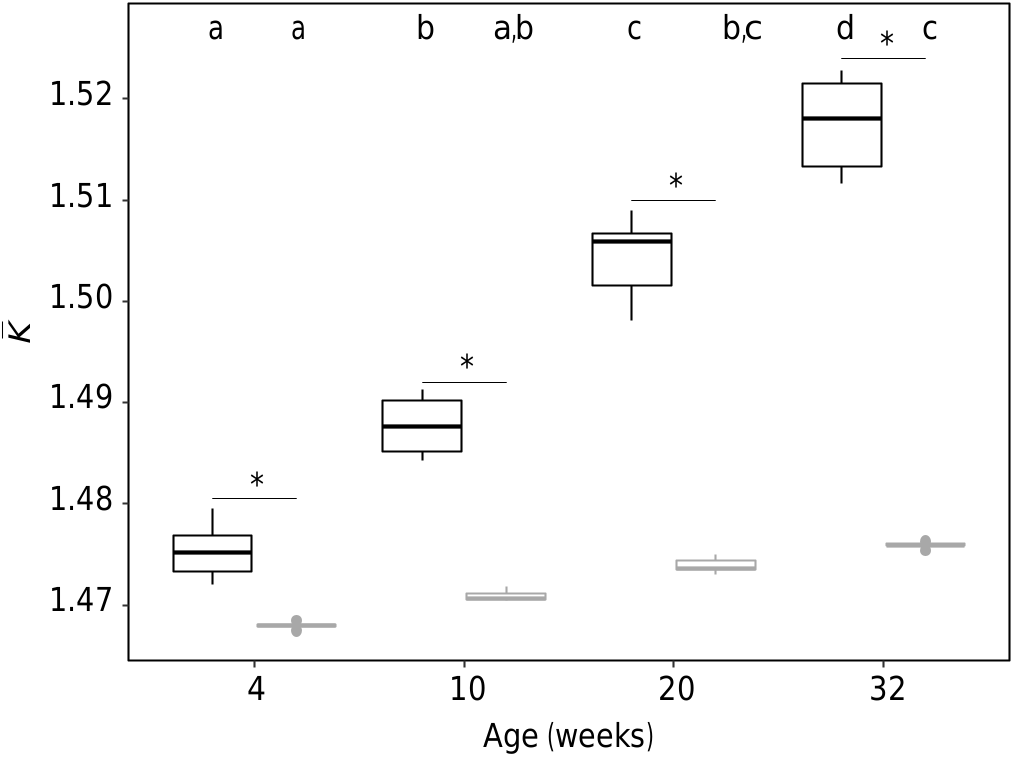
FIGURE 4 Box plots showing median (), 25th–75th percentiles () and range () of Salmo trutta condition at length (KÞ for exercised () and control () Salmo trutta cohorts across the experimental period (i.e., age) weeks 4–32 after treatment initiation (n = 6 per group). *, significant differences of pairwise least-squares means between exercised and control cohorts; different lower-case letters (black, exercise; grey, control) denote significant differences of pairwise least-squares means within treatments across the experimental period
No known copyright restrictions apply. See Agosti, D., Egloff, W., 2009. Taxonomic information exchange and copyright: the Plazi approach. BMC Research Notes 2009, 2:53 for further explanation.
|
Kingdom |
|
|
Phylum |
|
|
Order |
|
|
Family |
|
|
Genus |