Amplirhagada castra Solem, 1981
|
publication ID |
https://doi.org/10.3853/j.0067-1975.62.2010.1554 |
|
publication LSID |
lsid:zoobank.org:pub:749A271A-6942-4D4C-B0DF-B968462BFF0C |
|
persistent identifier |
https://treatment.plazi.org/id/03F987C5-FFA8-F765-0295-13184976C9A6 |
|
treatment provided by |
Felipe |
|
scientific name |
Amplirhagada castra Solem, 1981 |
| status |
|
Amplirhagada castra Solem, 1981 View in CoL
Amplirhagada castra Solem, 1981a: 286–293 View in CoL , pl. 13d, figs. 37h, 63a–b, 64b, 67e–f, 68 (Mitchell Plateau, Camp Creek).
Material examined. AMS C460966 (track to Mitchell Plateau ranger Station, 14.821 S 125.721 E) ( Fig. 1 View Figure 1 , Pl. 2.20).
Remarks. Found in the same area as A. varia and A. mitchelliana this species differs most significantly from the former two by a distinct anatomy of the interior penial wall. The penis anatomy of the present sample corresponds with that shown by Solem (1981a). This species is represented in the molecular tree shown below.
Molecular phylogeny
Phylogenetic trees were reconstructed for a sequence data set with a length of 655 bp that comprised 53 sequences representing 28 species of Amplirhagada and two out-group sequences of Carinotrachia . DNA was successfully extracted from up to 20 years old museum samples but it was not possible to amplify the mitochondrial COI fragment from all studied Amplirhagada species because DNA quality was sometimes low. Nevertheless, the phylogeny contains a representative subsample of the species treated in this paper.
Rates of transitions and transversions were plotted against sequence divergence (corrected after Tamura & Nei, 1993) by use of DAMBE (Xia & Xie, 2001) in order to test for substitution saturation. Both curves showed nearly linear relationships indicating no significant levels of saturation. A hierarchical likelihood ratio test implemented in Treefinder revealed the generally time reversible model of sequence evolution (GTR+I+Γ) as the best-fit model. Settings were adjusted accordingly in the following ML and BI analyses.
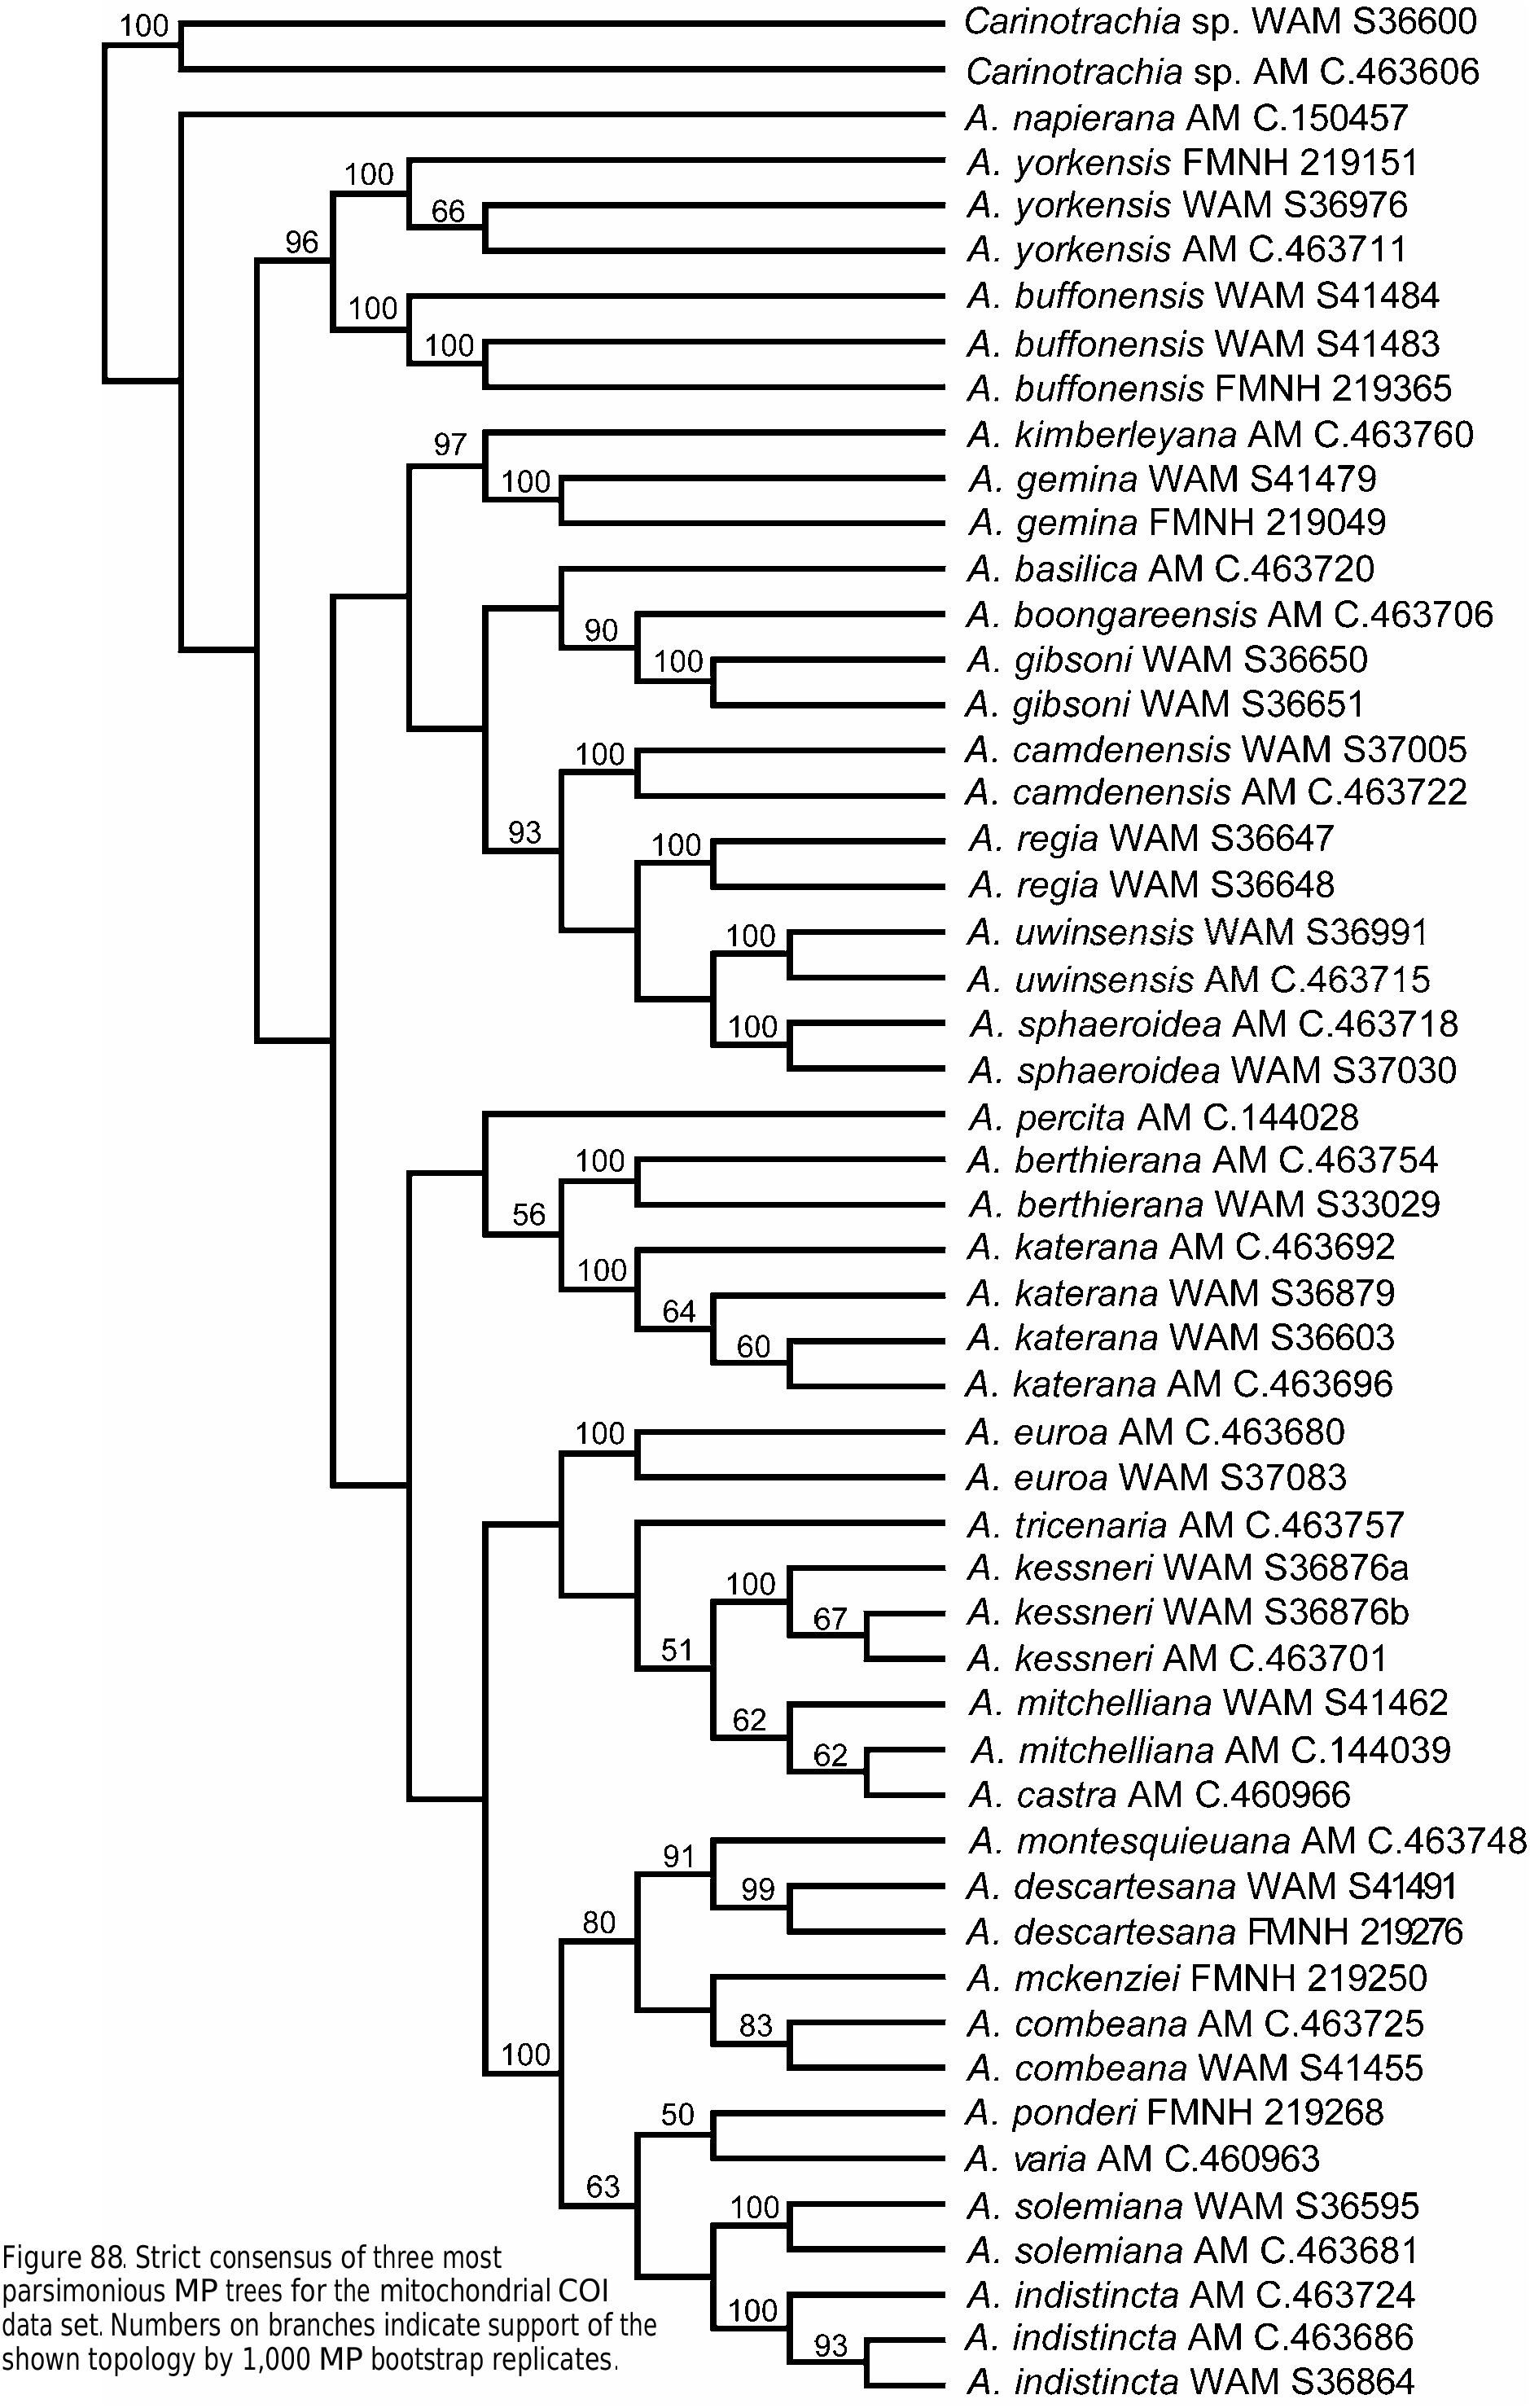
Trees obtained by the three different analytical techniques (MP, ML, BI) revealed widely congruent topologies that differed only in minor aspects. The maximum parsimony tree found by the MP Ratchet (length 2052 steps, Ci = 25, Ri = 66) showed A. napierana as the most basal offshoot within the genus ( Fig. 88 View Figure 88 ). By contrast, the BI tree ( Fig. 89 View Figure 89 ) and the ML trees (not depicted) showed this species in an unresolved relationship with respect to the out-group and all other Amplirhagada species. Next to A. napierana , all trees reveal essentially five species clusters ( Figs. 88–89 View Figure 88 View Figure 89 ). The basal relationships between these clusters are not well supported in terms of branch support values and are unresolved in the Bayesian tree ( Fig. 89 View Figure 89 ). Nodal support within the clusters, however, is usually high. The sister pair of A. buffonensis and A. yorkensis (Cluster 1) is consistently shown in a position basal to all other clades. Monophyly of this species pair receives high nodal support. The four other clusters contain species that do not always restricted to certain geographical areas. Cluster 2 ( A. kimberleyana and other species) encompasses taxa from Boongaree Island and all coastal areas south of it. Most of these species have rather dome-shaped shells (except for A. kimberleyana ) and are free sealers; the branching order is consistently revealed by all three trees. Cluster 3 contains species that are distributed to areas between the Napier Ranges in the hinterland ( A. percita ) to islands of the central Kimberley coast ( A. katerana , A. berthierana ). The MP cladogram indicates that species of Cluster 4 from the Mitchell Plateau ( A. castra , A. mitchelliana ) and A. kessneri from Bigge Island are more closely related to Cluster 2, while the BI shows the relationships between them and A. tricenaria as unresolved. Cluster 5 contains species from islands in the Admiralty Gulf and the Mitchell Plateau ( A. varia and others).
Pair-wise genetic distances within species did not exceed the maximum of 4% found between the two sequences of A. combeana . Average pair-wise distances between species usually range between 26 and 35% (corrected sequence divergence, Tamura & Nei, 1993) or 16 and 23% of uncorrected p-distance. Average interspecific distances between some species, which are very close to each other in the phylogenetic tree were not lower than 10% (Tamura-Nei distances) or 8% (p-distances).
No known copyright restrictions apply. See Agosti, D., Egloff, W., 2009. Taxonomic information exchange and copyright: the Plazi approach. BMC Research Notes 2009, 2:53 for further explanation.
|
Kingdom |
|
|
Phylum |
|
|
Class |
|
|
Order |
|
|
Family |
|
|
Genus |
Amplirhagada castra Solem, 1981
| Köhler, Frank 2010 |
Amplirhagada castra
| Solem, A 1981: 293 |


