Data, Walker, 1862
|
publication ID |
https://doi.org/10.1080/00222933.2018.1492749 |
|
DOI |
https://doi.org/10.5281/zenodo.5187620 |
|
persistent identifier |
https://treatment.plazi.org/id/9C08B818-6737-A119-FF79-6EB6FE60FD79 |
|
treatment provided by |
Felipe (2021-08-10 02:21:11, last updated 2024-11-28 10:28:24) |
|
scientific name |
Data |
| status |
|
Data View in CoL collection
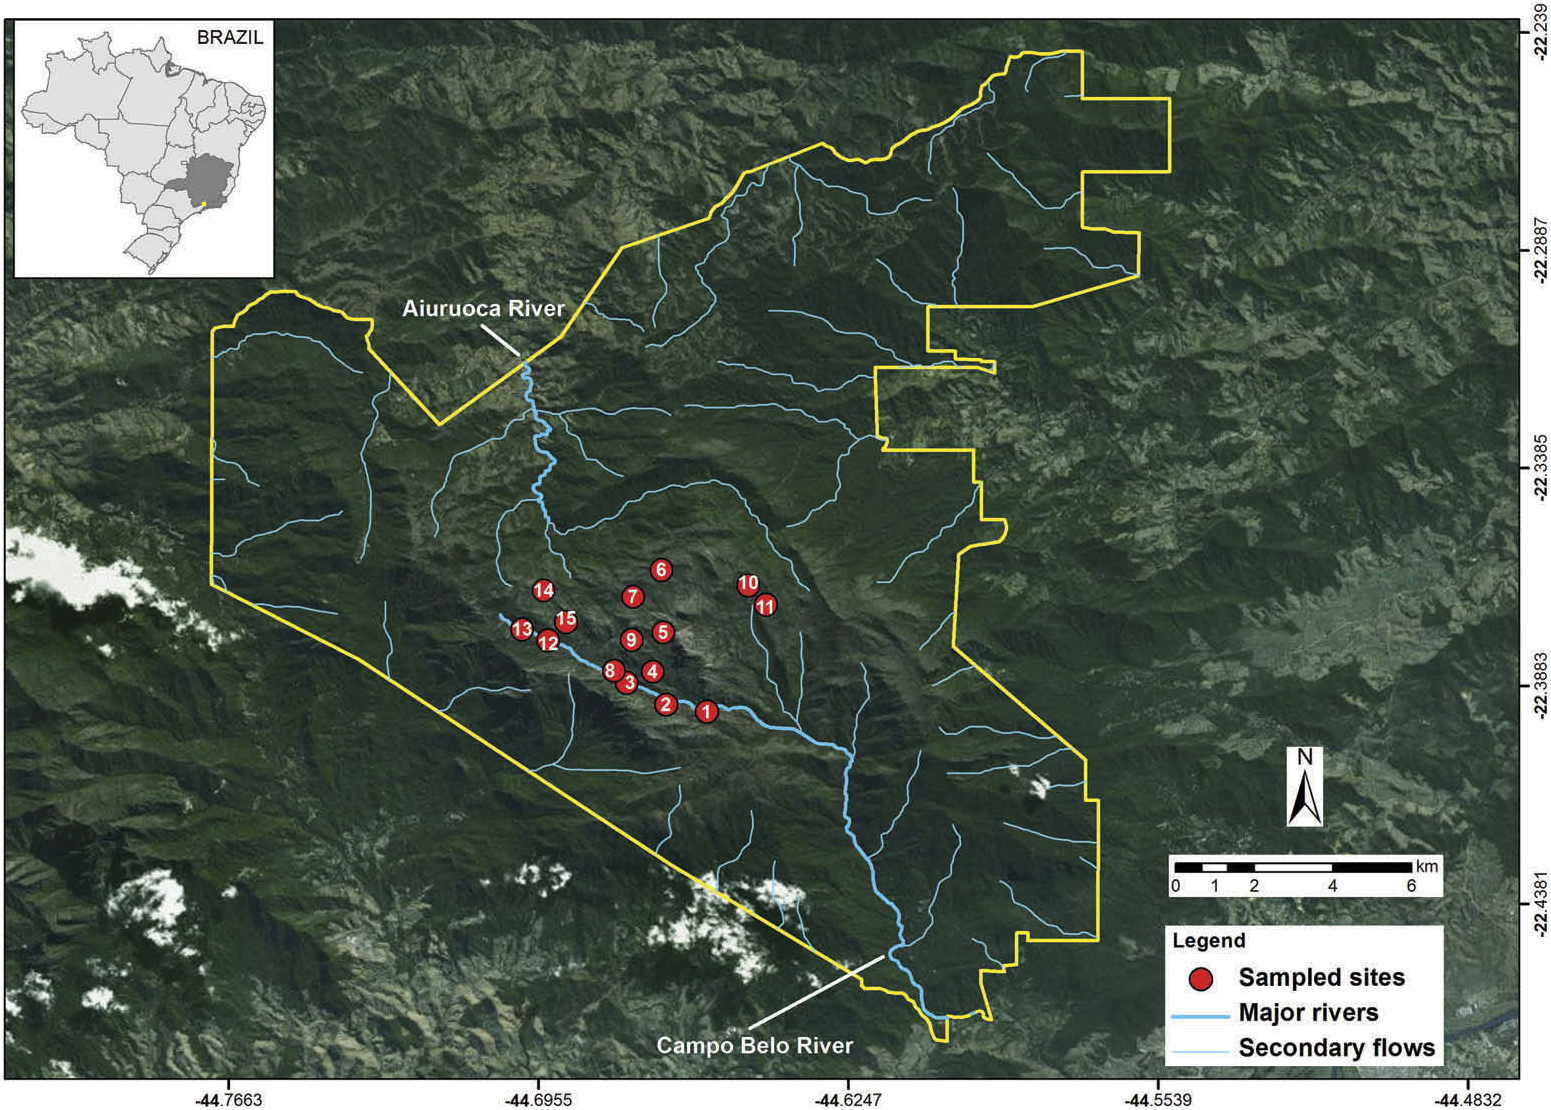
To assess the environmental variables related to the occurrence of capybara in high-altitude grasslands, we sampled 15 sites, spaced 600 to 1000 m apart, located in valleys with permanent water bodies, between 2280 and 2520 m altitude along the Aiuruoca and Campo Belo river basins ( Figure 1 View Figure 1 ). We conducted six bimonthly sampling campaigns between July 2014 and June 2015. In each sampling site, one observer performed an active search for 30 minutes for evidence of capybara presence, seeking to register capybara ‘tracks’ (e.g. footprint, faeces; Figure 2b and c View Figure 2 ). We choose 30 minutes of search because it is the average time spent to cover the entire valley of each sampling point (~3 ha). We chose to evaluate capybara occurrence using indirect tracks, and standardised by time, because our sampling sites were difficult to access and seasonally flooded, which did not allow us to set a fixed radius or transect. We did not perform direct counts because we believe the species presents a low density in our study area and individuals are rarely observed. In fact, we did not observe any capybara individuals.
We evaluated three environmental variables that may influence capybara distribution: the river basin (Aiuruoca and Campo Belo rivers), soil cover and vegetation structure. We categorised the soil cover and vegetation structure of each sampled site in the field, according to the method of Sanguinetti and Kitzberger (2010). We divided the soil cover into three categories: (1) dry rocky areas (high-altitude grasslands with rocky and dry areas); (2) waterlogged rocky areas (high-altitude grasslands with rocky areas and flooded at least 8 months per year); (3) waterlogged areas (high-altitude grasslands without rocky areas and flooded during at least 8 months per year). We divided the vegetation structure into two categories: (1) low (forbs and grasses); and (2) medium (shrubs and bamboo thickets).
From July 2013 to June 2014, we evaluated the effects of capybara herbivory on all reproductive stages of A. polyanthus in one of the largest marshes in the region, with around 2 ha of flooded area in the summer, situated at 2500 m asl. In a previous visit to the sampling area, we noticed that capybara herbivory was restricted to the vicinity of the flooded area. We therefore restricted our sampling to a 50-m radius around the freshwater marsh, where we recorded the number of rosettes of A. polyanthus , the proportion of those that underwent herbivory (we considered damaged rosettes those having at least 1/3 of the leaves with damage suffered by herbivory; Figure 2d View Figure 2 ), and the proportion of those that had not undergone herbivory (intact rosettes; Figure 2e View Figure 2 ). To assess the reproductive phenology of A. polyanthus , we counted the number of flowering and fruiting rosettes during 1 year ( Figure 2f View Figure 2 ; Freitas and Sazima 2006) during the monthly sampling. To study the effects of herbivory on reproductive phenology of A. polyanthus , we counted the number of damaged and intact rosettes that were in flower. Each rosette of A. polyanthus has 33 umbels on average ( Trovó et al. 2008); however, we discovered during field sampling that some damaged rosettes had only one umbel ( Figure 2g View Figure 2 ). We classified this as anomalous and counted the number of damaged rosettes with anomalies.
Freitas L, Sazima M. 2006. Pollination biology in a tropical high-altitude grassland in Brazil: interactions at the community level. Ann Mo Bot Gard. 93: 465 - 516.
Sanguinetti J, Kitzberger T. 2010. Factors controlling seed predation by rodents and non-native Sus scrofa in Araucaria araucana forests: potential effects on seedling establishment. Biol Invasions. 12: 689 - 706.
Trovo M, Sano PT, Winkworth R. 2008. Morphology and environment: geographic distribution, ecological disjunction, and morphological variation in Actinocephalus polyanthus (Bong.) Sano (Eriocaulaceae). Feddes Repert. 119: 634 - 643.
Figure 1. Study area showing the sampled sites (red circles) for capybara occurrence. The yellow line indicates the perimeter of Itatiaia National Park, located in the south-eastern region of Brazil.
Figure 2. (a) The high-altitude grasslands of the Itatiaia National Park, surrounding the studied marsh; (b) footprints and (c) faeces of Hydrochoerus hydrochaeris at the study site; (d) herbivory on the rosette of the Actinocephalus polyanthus by Hydrochoerus hydrochaeris; (e) normal rosette of the A. polyanthus; (f) normal flowering of A. polyanthus; and (g) anomalous flowering in rosettes of A. polyanthus that underwent foliar damage by capybara herbivory.
No known copyright restrictions apply. See Agosti, D., Egloff, W., 2009. Taxonomic information exchange and copyright: the Plazi approach. BMC Research Notes 2009, 2:53 for further explanation.
|
Kingdom |
|
|
Phylum |
|
|
Class |
|
|
Order |
|
|
Family |
1 (by felipe, 2021-08-10 02:21:11)
2 (by ExternalLinkService, 2021-08-10 02:31:35)
3 (by ExternalLinkService, 2021-08-10 08:38:19)
4 (by ExternalLinkService, 2021-08-12 12:46:55)
5 (by ExternalLinkService, 2022-01-29 14:49:46)
6 (by plazi, 2023-11-03 21:31:02)


