
Spirostomum teres, Claparède & Lachmann, 1858
|
publication ID |
https://doi.org/ 10.4467/16890027AP.20.002.12158 |
|
DOI |
https://doi.org/10.5281/zenodo.11105101 |
|
persistent identifier |
https://treatment.plazi.org/id/AF2EDF67-770D-FFE8-FCF5-ACD994804AA2 |
|
treatment provided by |
Felipe |
|
scientific name |
Spirostomum teres |
| status |
|
The ciliate sampling dates and layers, and S. teres numbers are pooled in the Figure ( Fig. 3 View Fig ) along with the hypoxic layer (DO <1 mg L –1) average numbers of the ciliate. S. teres was found first in the near bottom / 60 m samples and in the oxycline from May through September/November since the launch of ciliate monitoring in Alchichica in 2003; the first years’ sampling was limited to five to 10 layers, i.e., the register would not be complete ( S. teres was misidentified in Peštová et al. 2008 and Bautista-Reyes and Macek 2012 as Chaetospira sp. ). Typically, S. teres was colonizing the oxycline just after the stratification (May) but still it has been found in the very bottom layer until 2009 (the end of the first monitoring period). Maximum numbers of 700 cells L –1 were found within the sampled layers, while the average number integrated through the whole hypolimnion (OD <1 mgL –1) was found regularly up to 150 cells L –1; a high number of 530 cells L –1 was found when the anoxic layer was limited to the very bottom layer on May 2005.
Since 2011 when the sampling already included over 10 layers within- and below-oxycline (bubbles in the Fig. 3 View Fig ), S. teres has gradually disappeared from the bottom and it was found in quite restricted layer below the oxycline. However, still in August 2011 the maximum bottom abundance of S. teres (1900 cells L –1) was observed. The samples were not taken during the whole stratification period but it seems the pelagic population of S. teres was decreasing. Frequently, annual maximums of 1000 to 2100 cells L –1 were found during the stable stratification with the light penetrating the microaerobic layer (July–August of 2011, 2012, 2013, 2016). On the other hand, S. teres has not been found during the finishing stratification that was not already supported by strong temperature gradient while oxygen stratification persisted; in 2016, the last samplings within the study, S. teres was absent already from November. Additionally, January peak (265 cells L –1) was found around 45 m during the uncomplete mixing in 2016.
Examples of the whole limnologic variables, which accompanied the typical S. teres vertical distribution are pooled in the Fig. 4 View Fig . In Alchichica, the ciliate distribution was extended through the metalimnion during July–August ( Fig. 4 a–h View Fig ). There was no evident exceeding maximum but S. teres was observed in much wider metalimnion-hypolimnion boundary layers, following cyanobacterial pigments distribution, below the chlorophyll a, phycoerythrin and phycocyanin maximums. Still, apparent photosynthetic anoxygenic bacteria (PAB) were not so important there. Maximum abundances were found located 2 to 4 m below the limit of DO. Also nitrates were sometimes peaking there.
3
Contrasting situation was found at the end of the stratification period, when higher ciliate numbers were observed in a strictly limited oxygen boundary ( Figs. 3 View Fig , 4 View Fig ), accompanied by above mentioned bacteria. Nitrite peak was not as high as in July but, percentually, it was important ( Fig. 4 c, g, k, o View Fig ).
Very similar S. teres distribution pattern was found in nearby lake La Preciosa ( Fig. 5 a–f View Fig ). S. teres was found in higher numbers in similar DO conditions but below the phycocyanin maximum (composed by picocyanobacteria colonies and/or aggregates) and just above the maximum of chlorophyll a.
A meromictic Lake La Cruz ( Spain) showed similar S. teres distribution pattern even though on a ¼ m distance basis ( Fig. 5 d View Fig to f). The ciliate was found peaking in a very narrow layer just within the maximum of pigments, in a limit of DO.
According to QPS preparations, the ciliates from the three lakes were morphologically very similar even though, different composition of water did not permit to obtain all cells equal impregnated ( Fig. 6 View Fig ).
Spirostomum teres View in CoL feeding
During the study, the samples inspected in vivo did not present any colour that could be related directly to their food (the ciliate was yellowish to brown due to its pigment granules). Vacuole content was analysed in all S. teres samples using its fluorescence & DAPI staining both in the quantitative ciliate samples fixed primarily with Lugol and in the samples fixed with formalin, in which fluorescence of picocyanobacteria and chlorophyll bearing eukaryotes persisted longer – up to one week; FLB were very well distinguishable in both treatments. However, to observe DAPI stained heterotrophic bacteria inside the vacuoles was almost impossible for the samples fixed with Lugol but according to the size of a vacuole and the content of APP we were able to estimate their relative content ( Fig. 7 View Fig ).
Samples from all three lakes showed abundant APP inside the vacuoles along with algae ( Fig. 8 View Fig ). Alchichica samples presented relative lower amount of then but still, they were observed throughout the season in all layers, including the very bottom. In Alchichica, within the larger feeding particles, apparent purple sulphur bacteria ( Thiocapsa -like; genus to be confirmed) were observed in protargol impregnated samples and in IRtaken autofluorescence images ( Fig. 9 View Fig ), typically at the end of stratification (October–November). However, throughout the study, sulphur bacteria did not form the dominant content of food vacuoles.
Sulphur bacteria were not found abundant inside the cells neither in La Preciosa or La Cruz samples, even though they were very abundant in the latter lake. Other apparently photosynthetic anoxygenic bacteria from La Preciosa (numbers not shown) were not observed ever to be ingested.
Other photosynthetic organisms like green algae or diatoms were found frequently although, with some exception, forming only a part of the cell content. Alga Monoraphidium minutum , which was observed frequently throughout the water column even during stratification (including hypoxic/anoxic hypolimnion), was the most important ingested eukaryote but only in the July 2016, several specimens hosted dominantly the alga ( Fig. 7c View Fig ). Other typical food was a minute diatom Cyclotella choctawhatcheeana , sometimes found in Alchichica S. teres while very numerous in La Cruz sampling and experiment ( Fig. 6c View Fig ). No important eukaryotes were found in the S. teres population of La Preciosa.
Feeding rate experiments (pooled in the Table 1 View Table 1 ; Fig. 10 View Fig ) were evaluated during late stratification of the crater lakes giving similar results for the samples with abundant ciliates. Typical Alchichica clearance rate laid about 2000 nL cell –1 h –1, which represented in average 130 to 210 cells cell –1 h –1 ingested. La Preciosa population showed roughly similar clearances but the grazing rates were much more variable in different layers reaching sampling averages 46 to 488 cells cell –1 h –1 ingested.
Field measurement of Lake La Cruz S. teres population did not give positive results due to the logistic problems. However, the experiment with the whole community transported to the laboratory had success. The clearance rates were observed being much lower than those from Mexican lakes; on the other hand, grazing was similar to Alchichica data.
Ecological relationships
With some exceptions, the oxycline and hypolimnion layers, where S. teres was found, showed oxygen concentration below 1 mg L –1 with maximum over 2000 cells L –1 at DO of 0.2 mgL –1 and lower ( Fig. 11 View Fig ). Notoriously, S. teres was found at DO below the accuracy limit within the completely anoxic hypolimnion. The ciliates were observed regularly at the very bottom including in anaerobic conditions until 2011, when large number of 1900 cells L –1 was found. S. teres appeared there again in 2016 ( Fig. 3 View Fig ).
To see a possible anaerobic respiration within the sampled layers, S. teres numbers were plot against DO and a nitrate concentration ( Fig. 12 View Fig ). S. teres maximums were found upon concentrations over 1 µmol L –1 both with traces of DO (0.1 through 0.2 mgL –1) and at an anaerobic bottom. Also according to the occurrence of S. teres (percentage of positive samples within a logarithmic scale of concentration intervals), the ciliate preferred nitrate concentrations between 0.6 and 2.5 µmolL –1 while upon concentrations over 6.3 µmolL –1 the ciliate was not observed.
The same plot but applying the concentration of nitrite ( Fig. 13 View Fig ), a possible respiration product, did not give clear results; nitrites> 1 µmol L –1 coexisted with DO> 1 mg /l but the ciliate was extremely scarce in such conditions. According to the occurrence of S. teres , the ciliate preferred nitrite concentrations between 0.1 and 1 µmol L –1 while hypolimnetic S. teres maximums were observed between 1 and 2 µmolL –1. The ciliate occurrence was higher again over 2 µmol L – 1 in the completely anaerobic conditions but the ciliate numbers were not considerably higher in such conditions.
From the point of view of picoplankton source of feed ( Fig. 14 View Fig ), S. teres was observed upon APP numbers varying roughly two orders of magnitude (2 × 10⁴ to 2 × 10⁶ cells mL –1) with occurrence peaking within 6 × 10⁴ to 1 × 10⁵ cells mL –1 (logarithmic scale of categories was applied). In case of HPP, the registered optimum was observed round 1.4 × 10⁶ cells mL –1, typically covering the interval 7.8 × 10⁵ to 2.8 × 10⁶ cells mL –1 (occurrence graph is not shown but dots in the Fig. 4 View Fig represent APP vs. all HPP data). The lowest HPP numbers were observed in the anaerobic hypolimnion while the highest ones in the oxycline.
In the plot of S. teres numbers against PAR and APP ( Fig. 15 View Fig ) we could confirm that the ciliate occurrence upon above mentioned APP numbers is also supported with the available radiation in the layer / habitat, excluding the samples from uncomplete mixing event. According to occurrence, S. teres preferred PAR between 0.04 and 0.6%, with slight preference for 0.2 to 0.6% interval. However, the occurrence of S. teres was also considerable in the dark hypolimnion and bottom. While the ciliate was more common in the hypolimnion, higher numbers were found in above the bottom-layer.
The dbRDA analysis of the Lake Alchichica samples where S. teres was present covered the layers from 21 to 61 meters (the very bottom). The results (pooled in the Fig. 16 View Fig ) show that the first axis of the ordination (dbRDA1), explained the higher percentage of the variation (88.6%), and was polarized by the concentrations of dissolved reactive phosphorus (DRP) and nitrate (NO 3 –). The second axis (dbRDA2) explained a much smaller proportion of the variation (7.8%) and can be associated to the oxic-anoxic gradient. The abundance of HPP and S. teres is associated to microaerophilic and anoxic phosphorus-rich environments with higher nitrite (NO 2 –) and ammonium (NH 3) concentrations. However, in the ordination plot APP is located in the opposite side of DRP, in environments with the lowest concentrations of phosphorus and with a higher concentration of oxygen and nitrate within the oxic-anoxic gradient.
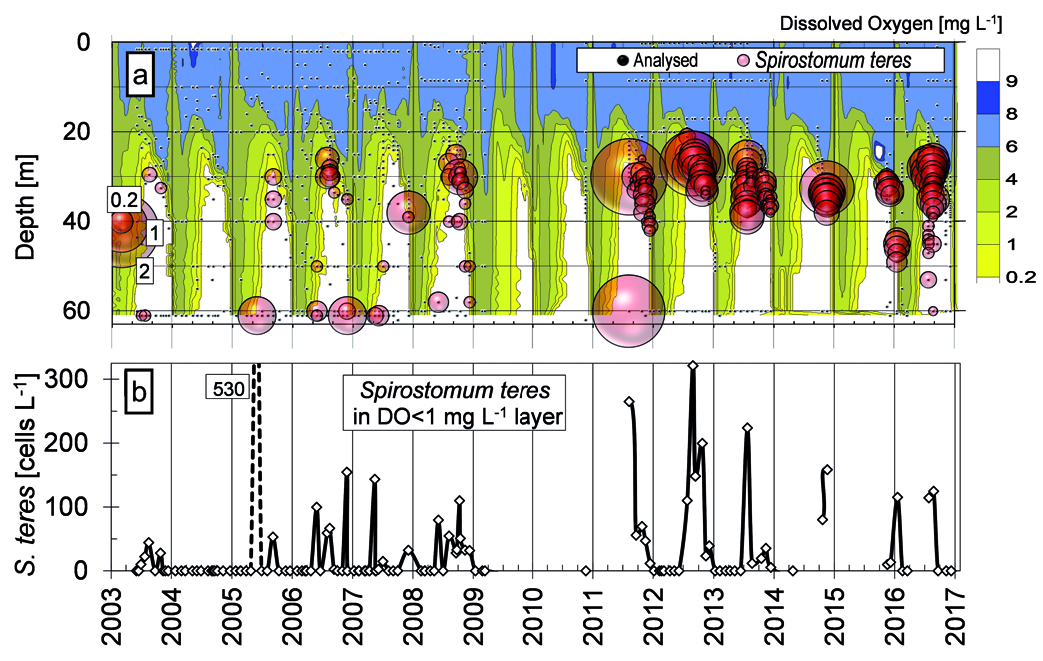
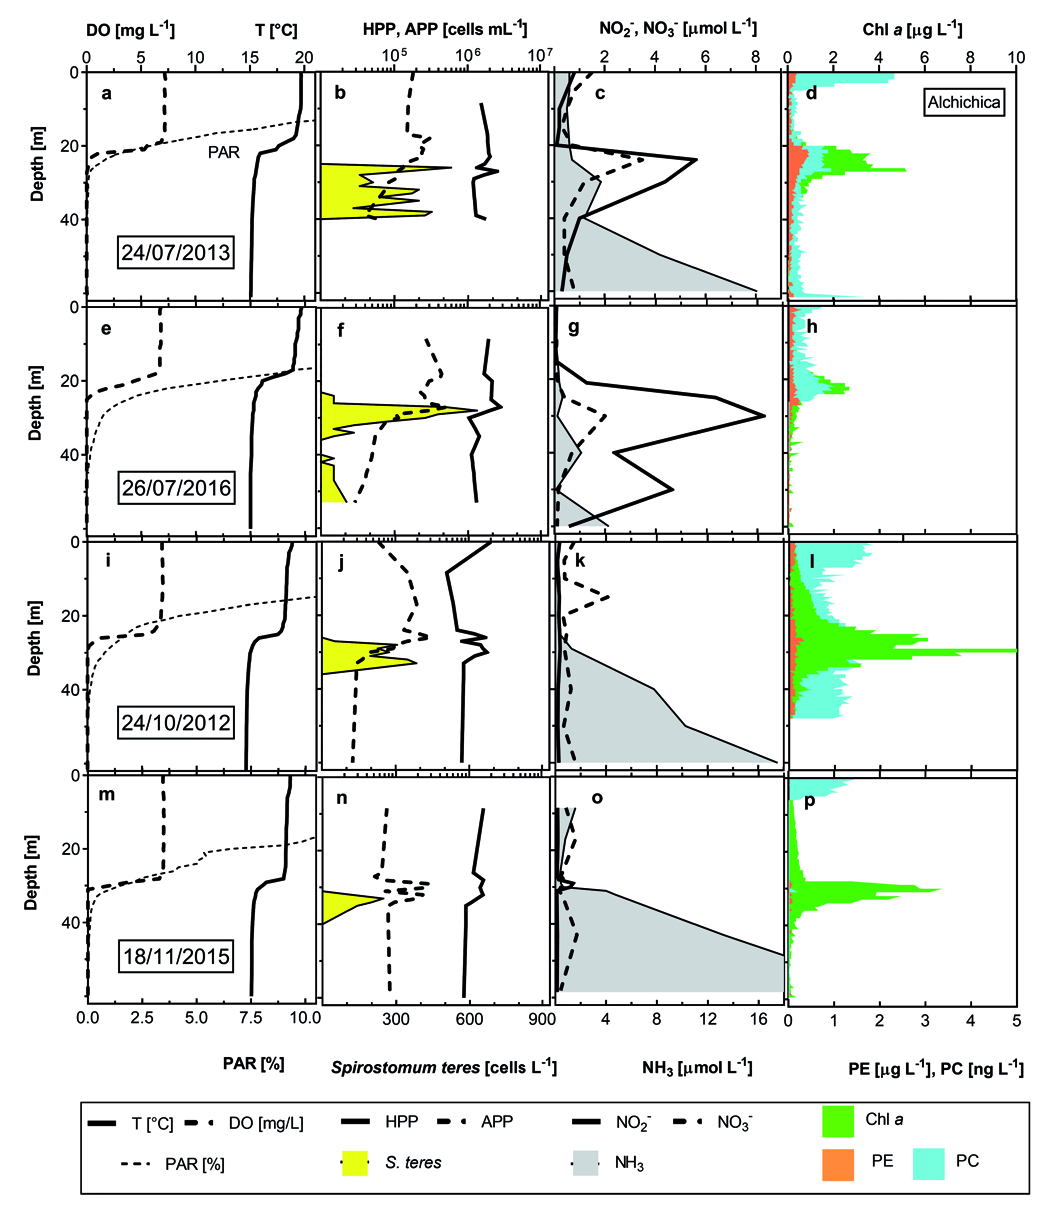
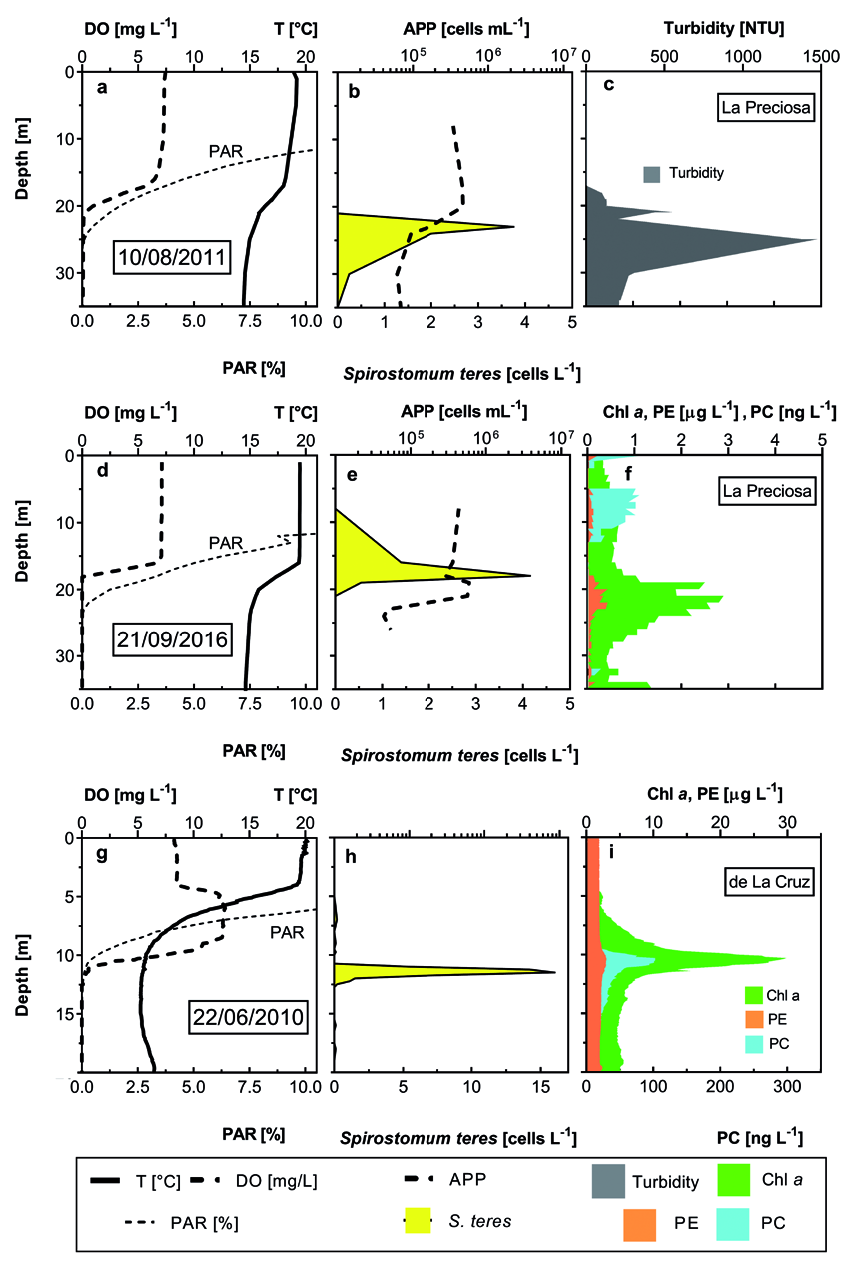
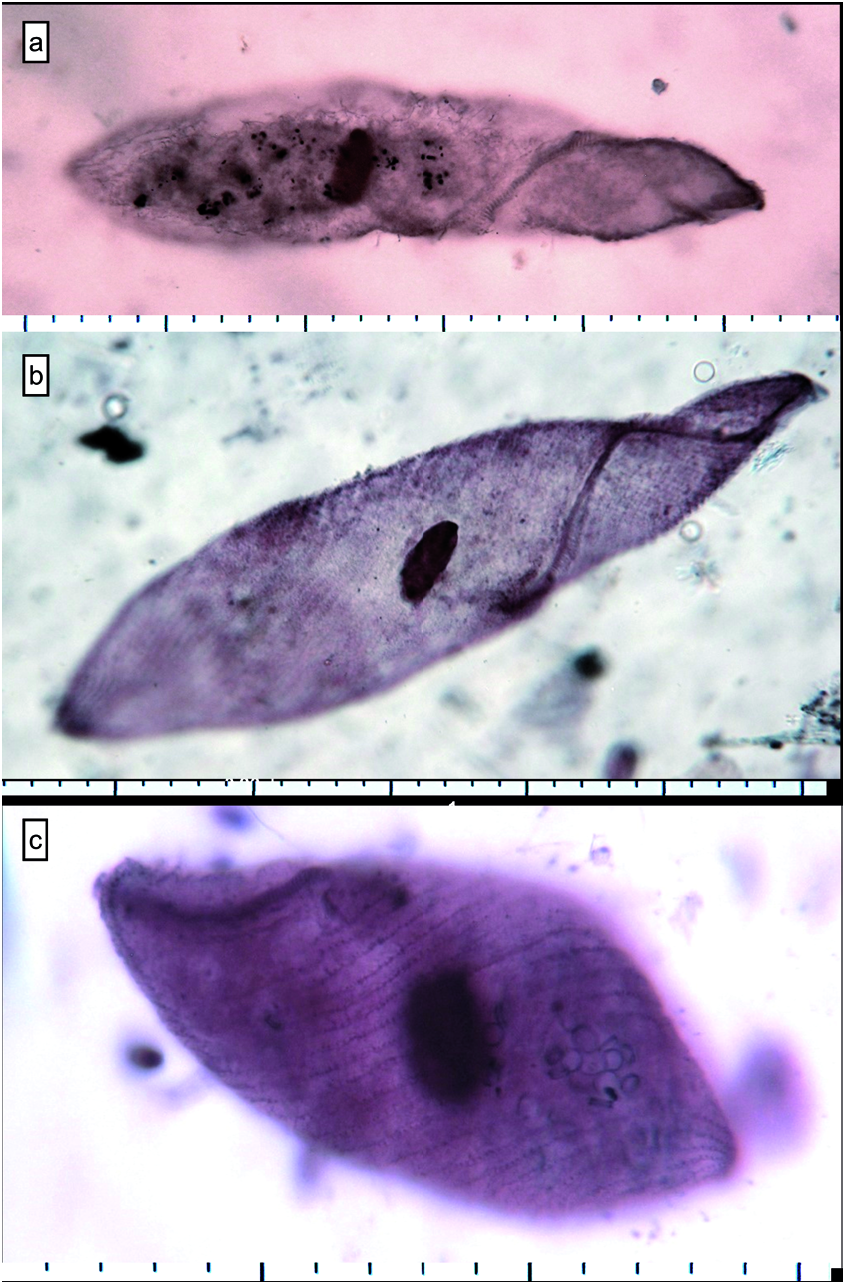
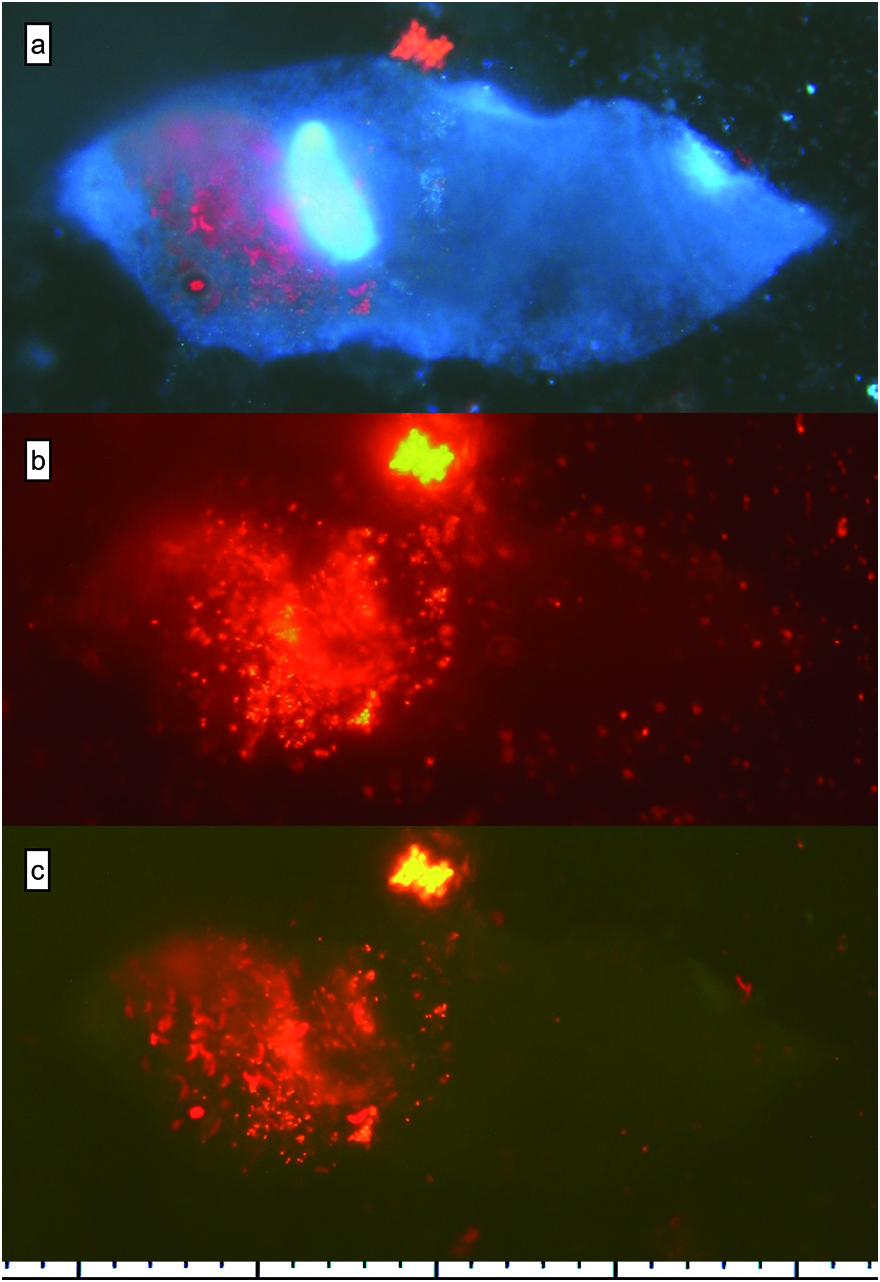
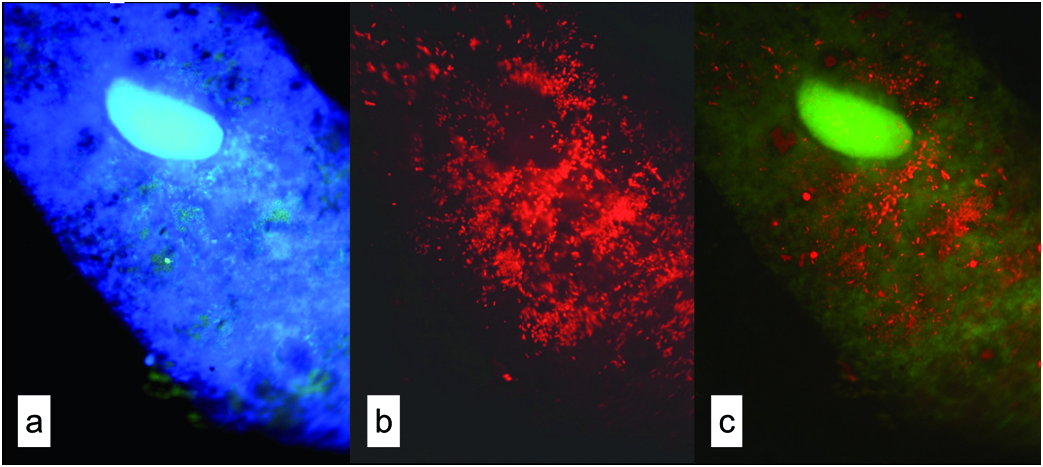

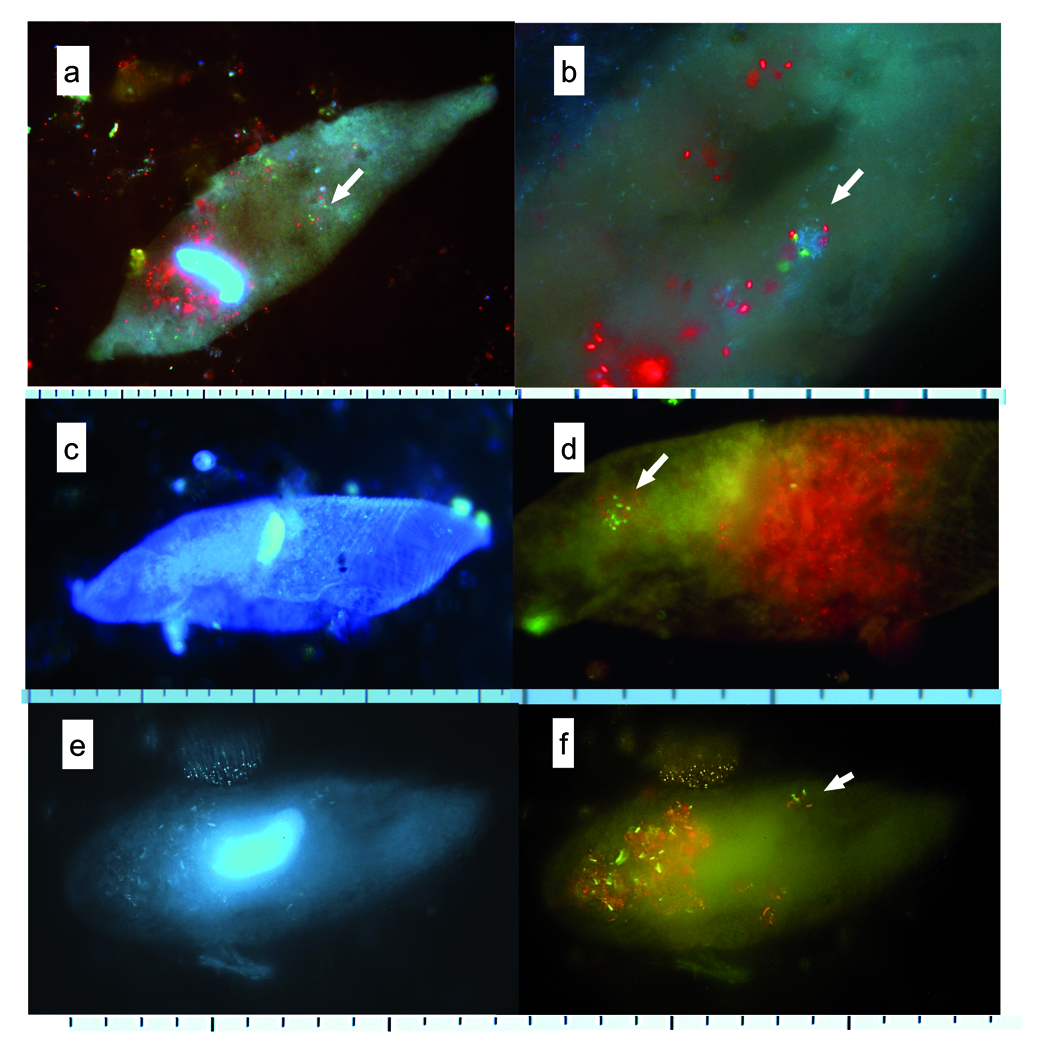
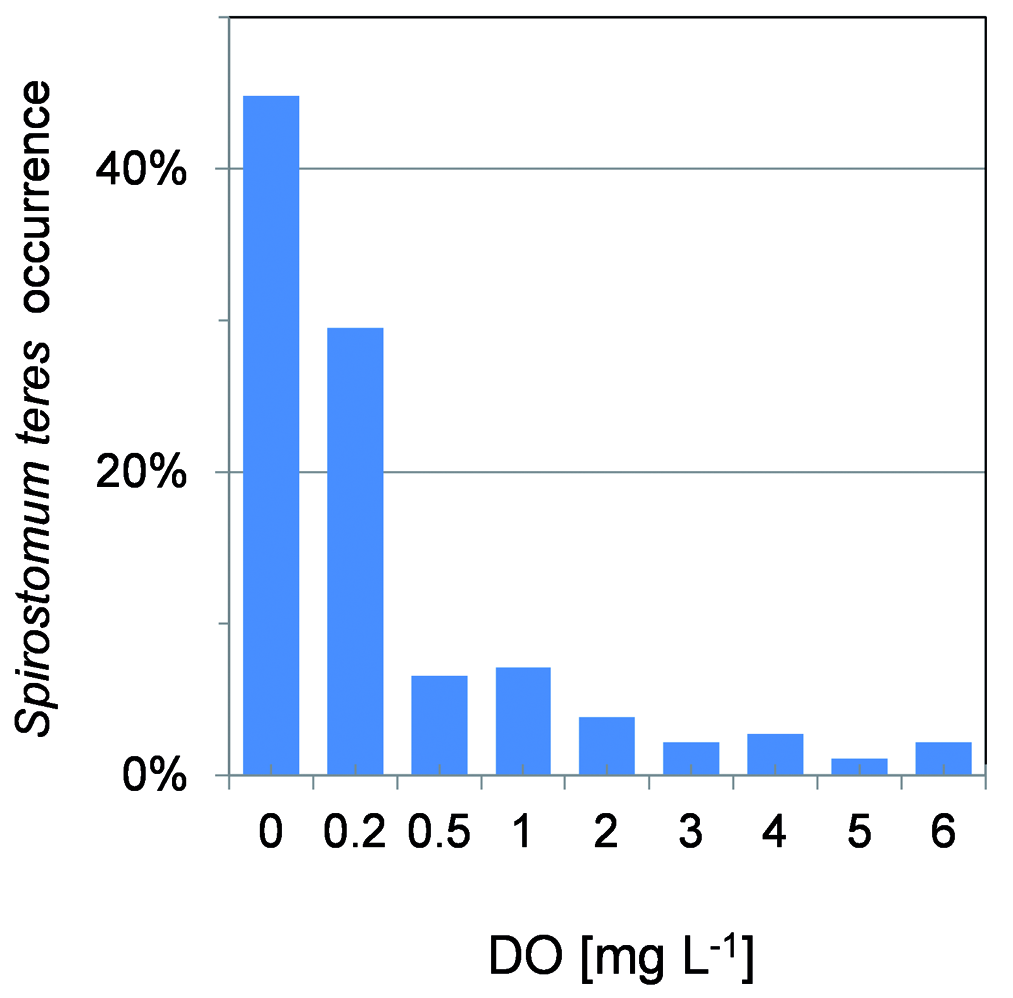
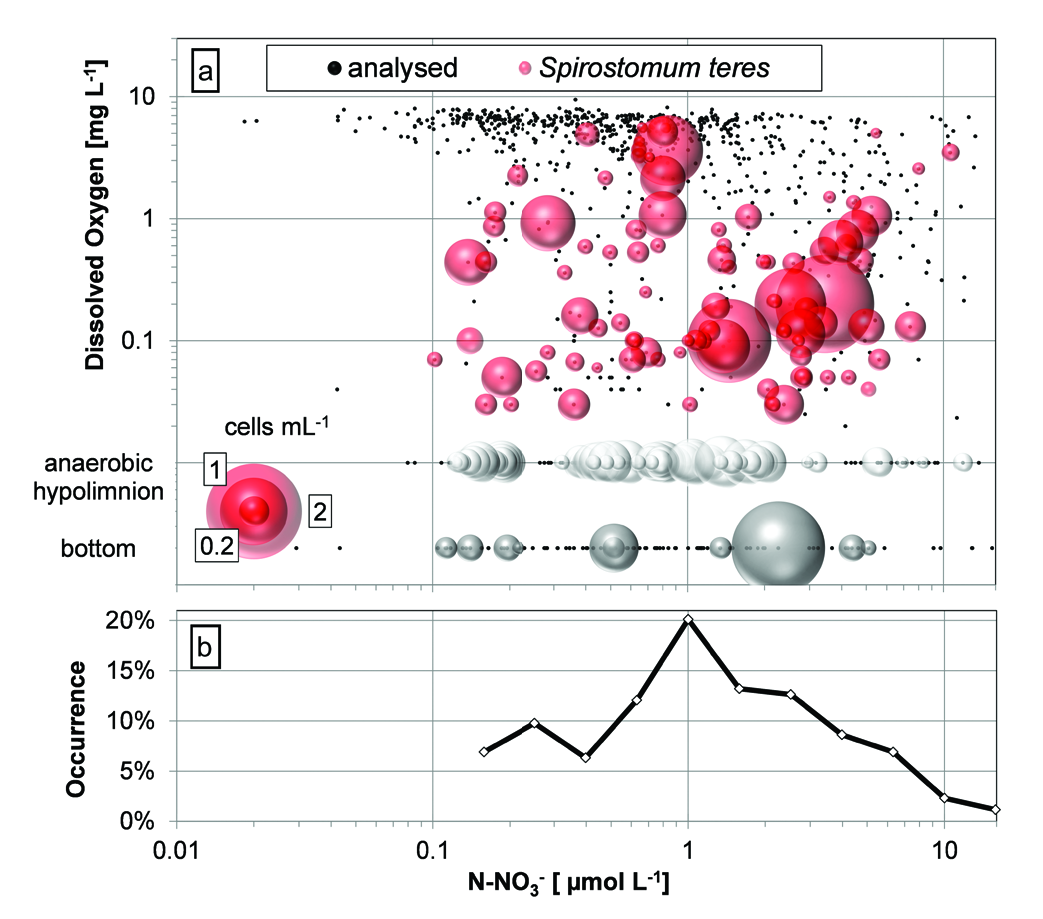
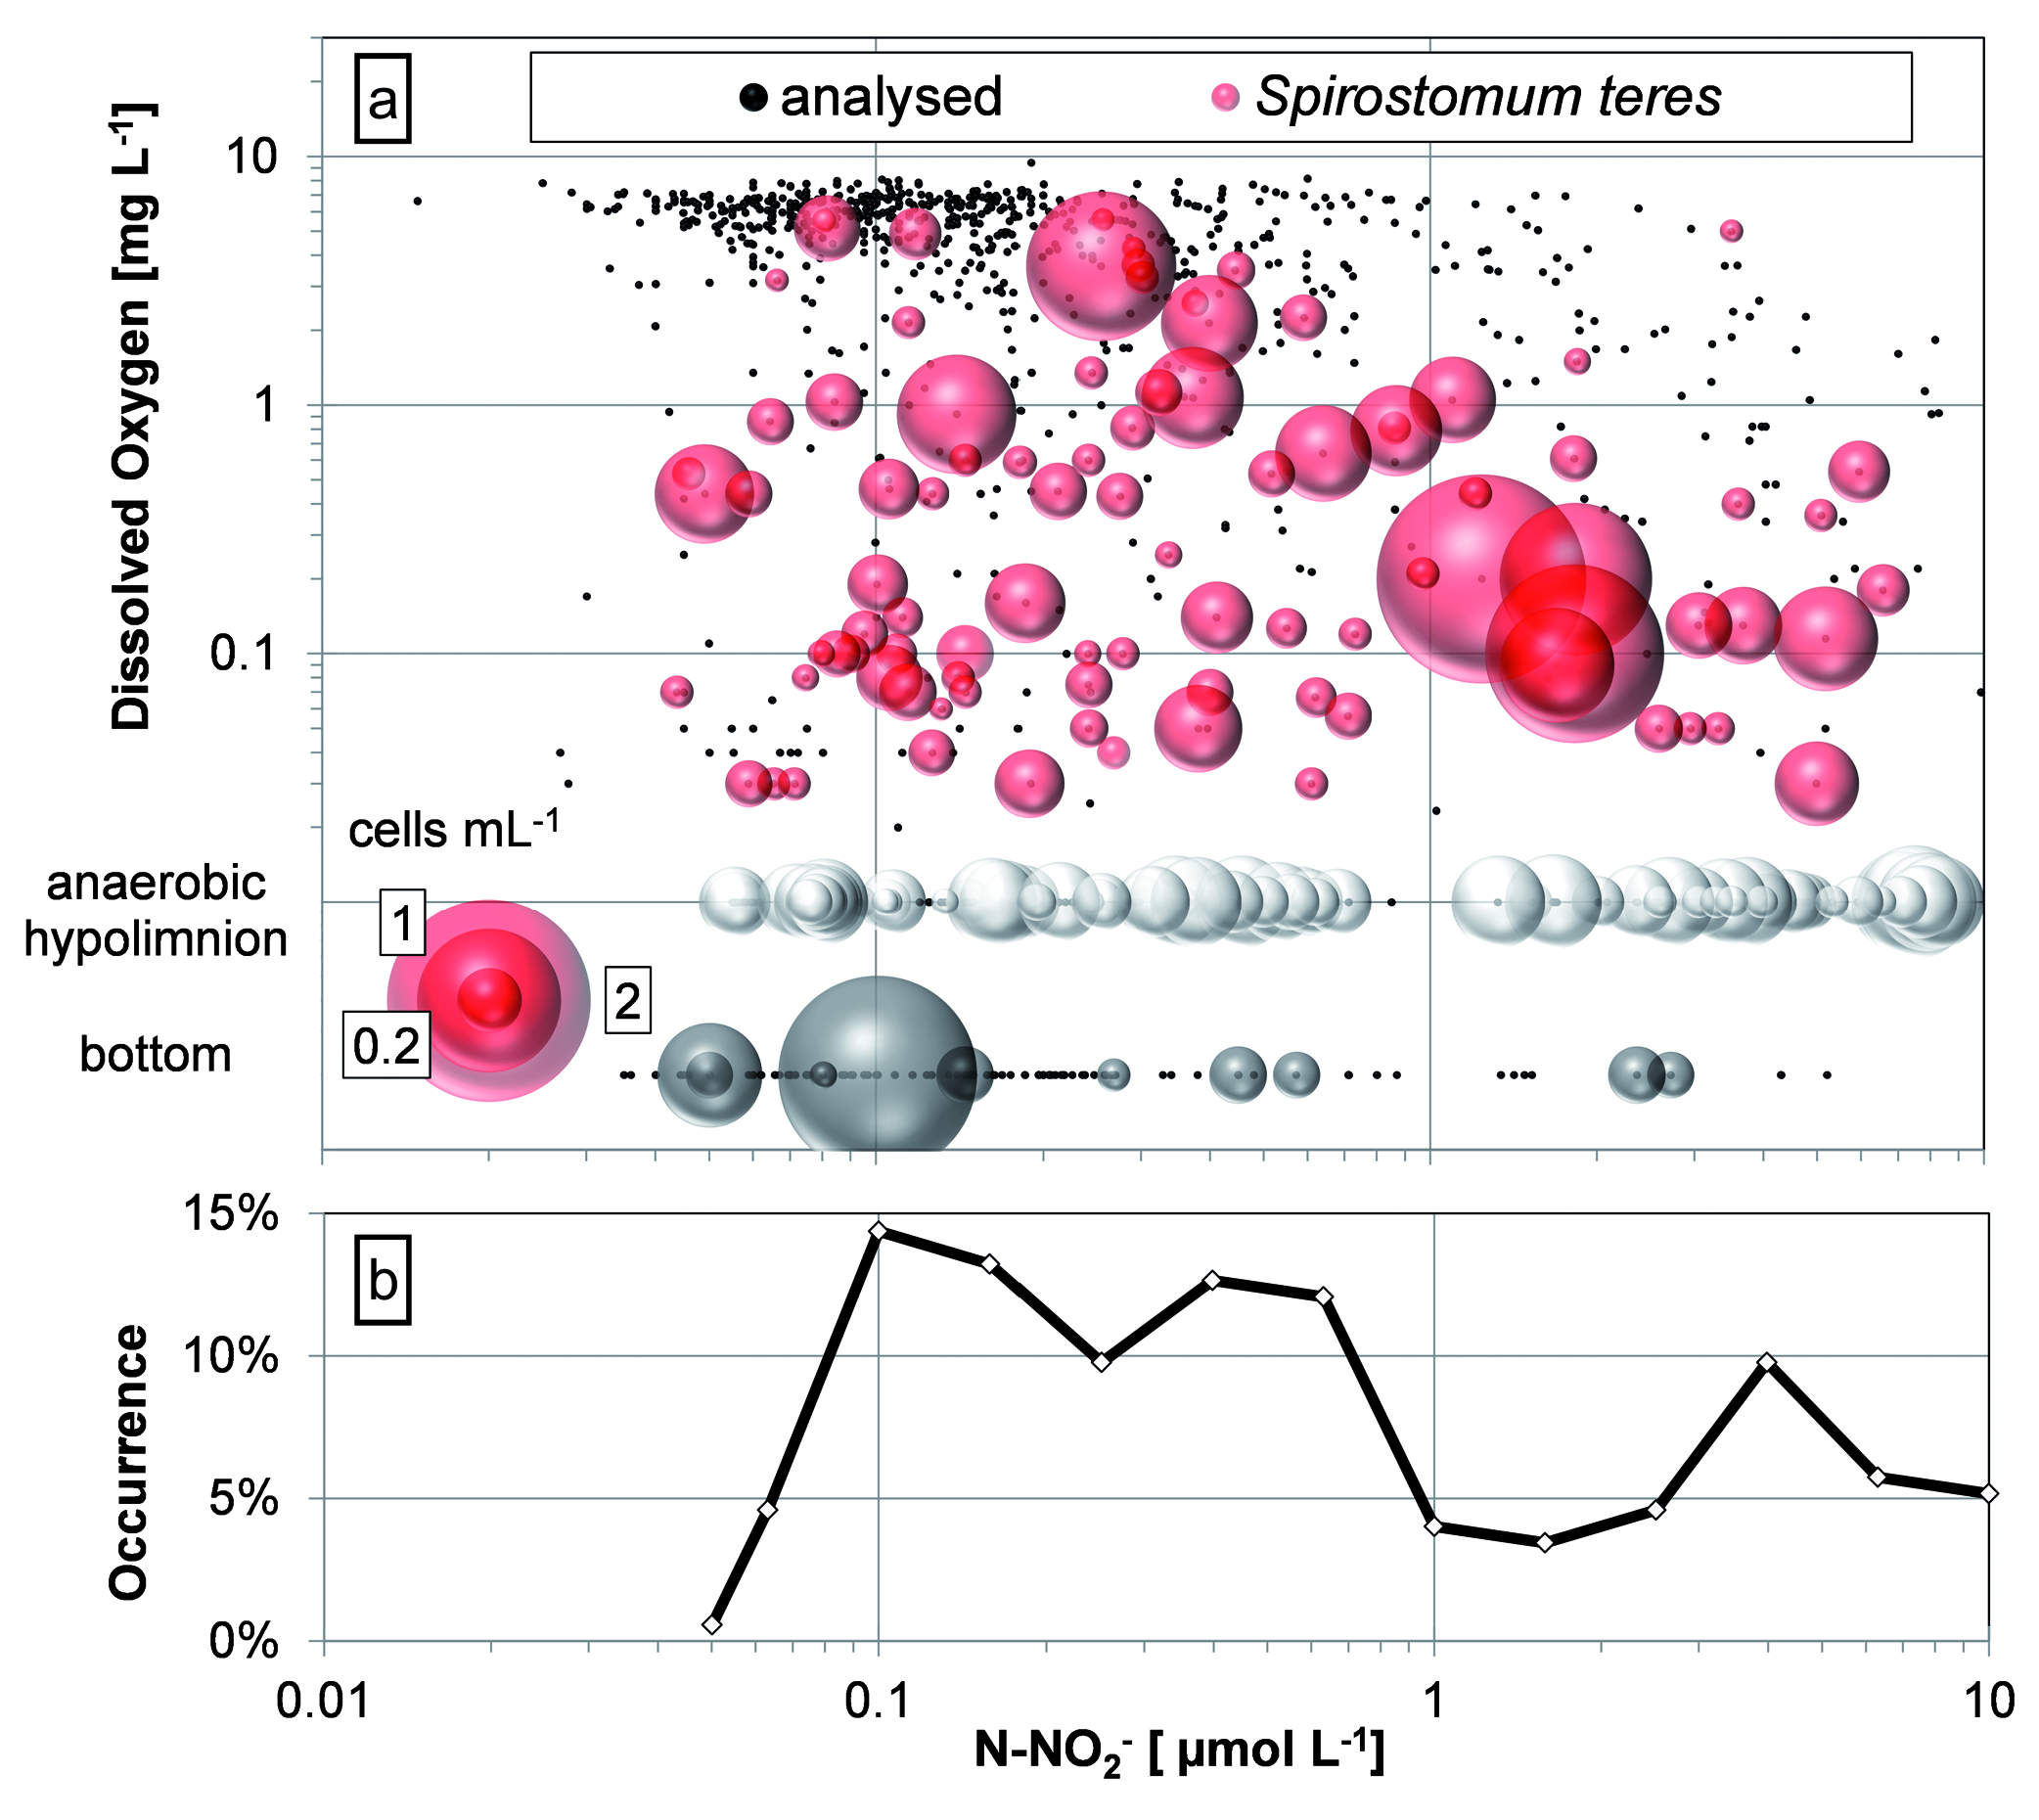
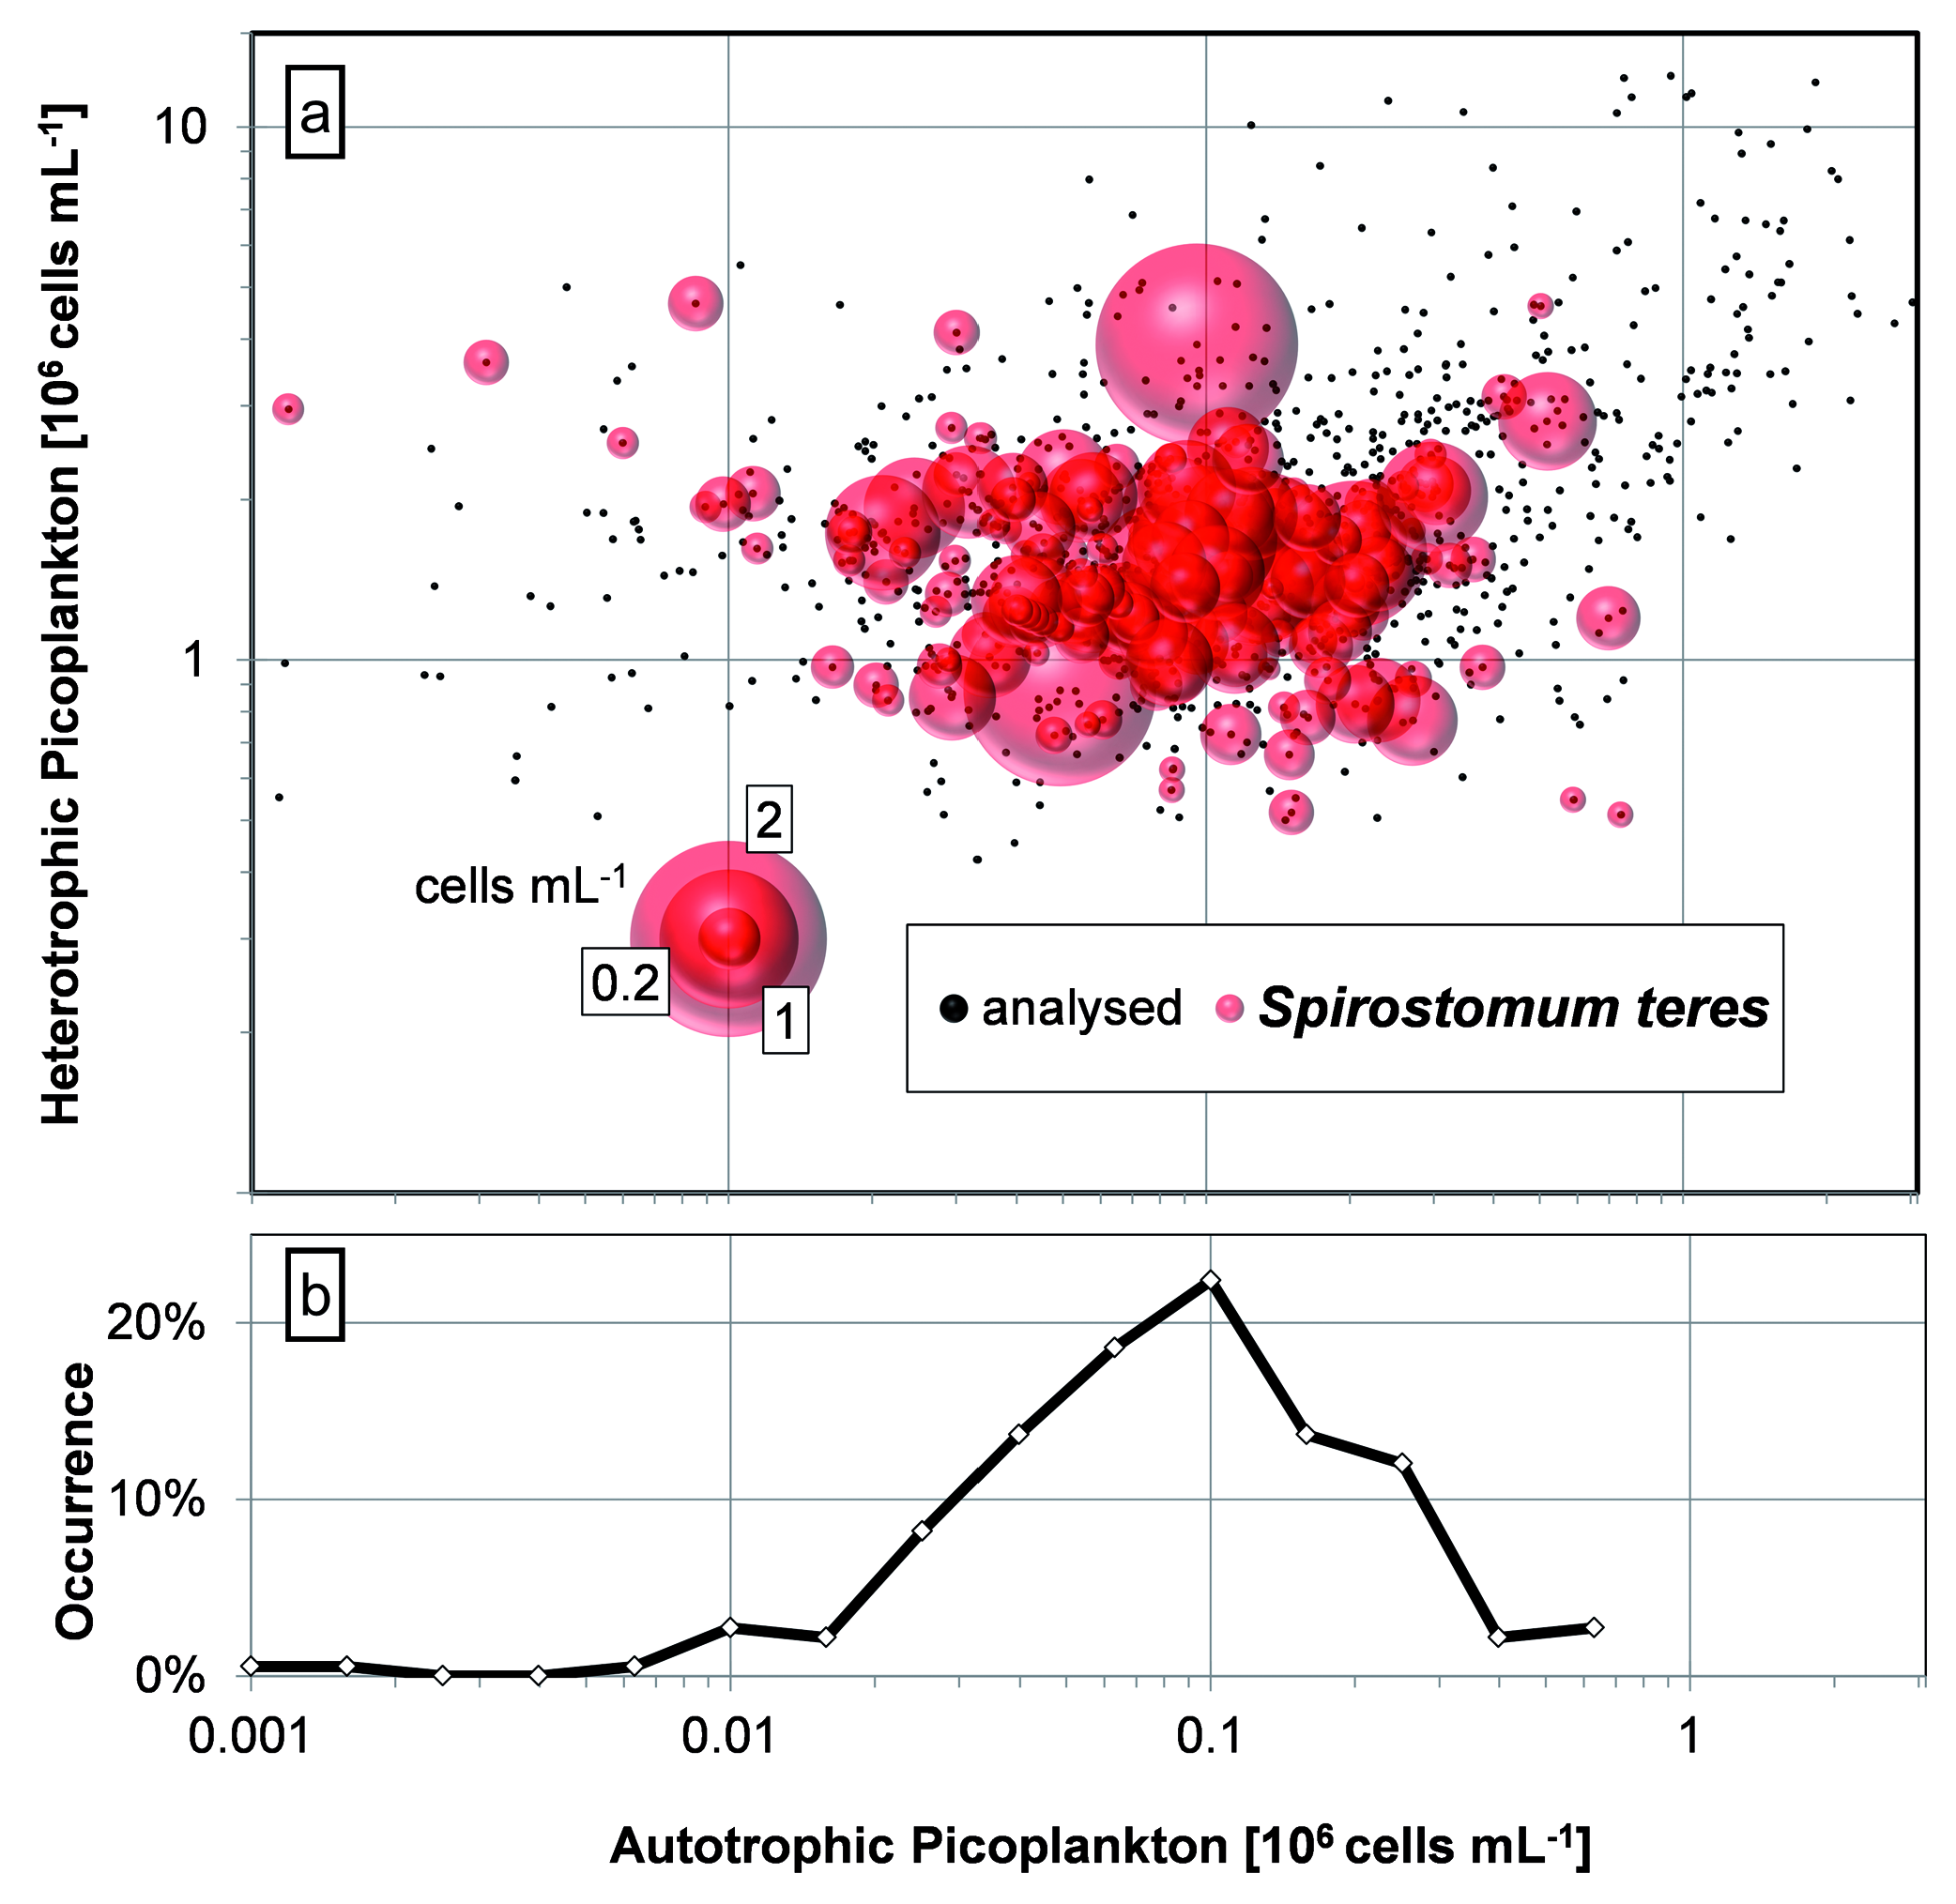
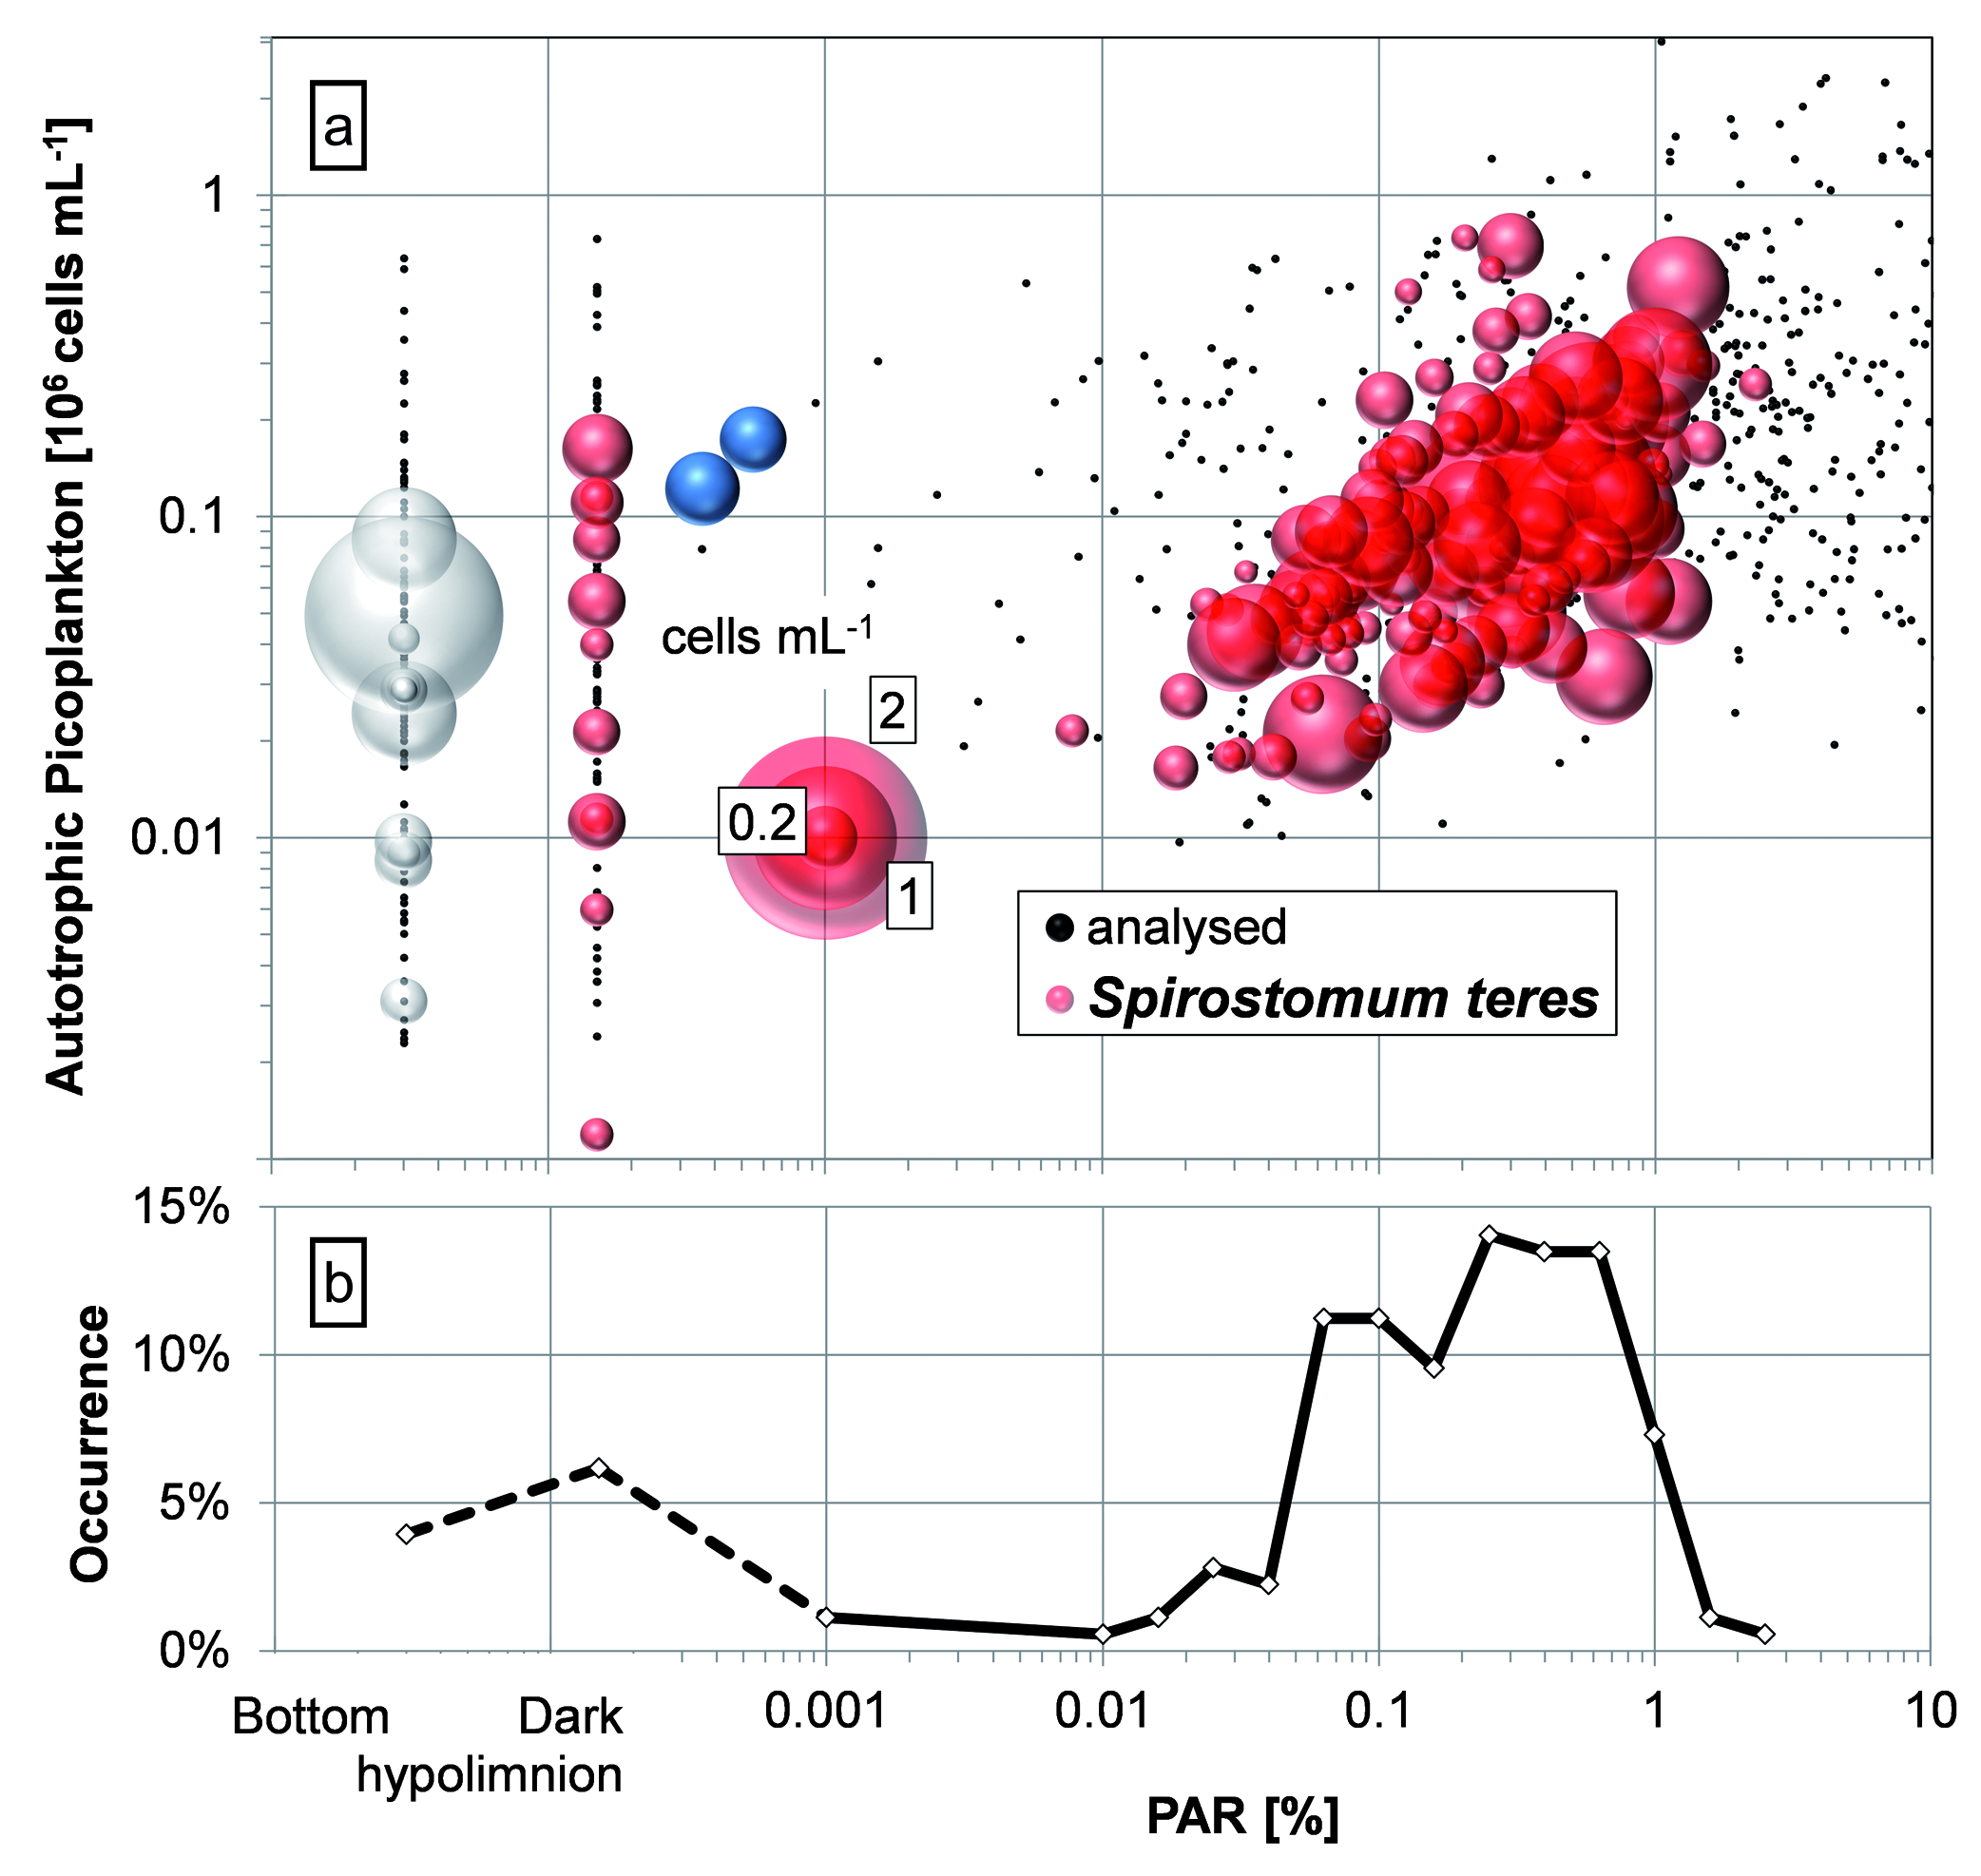
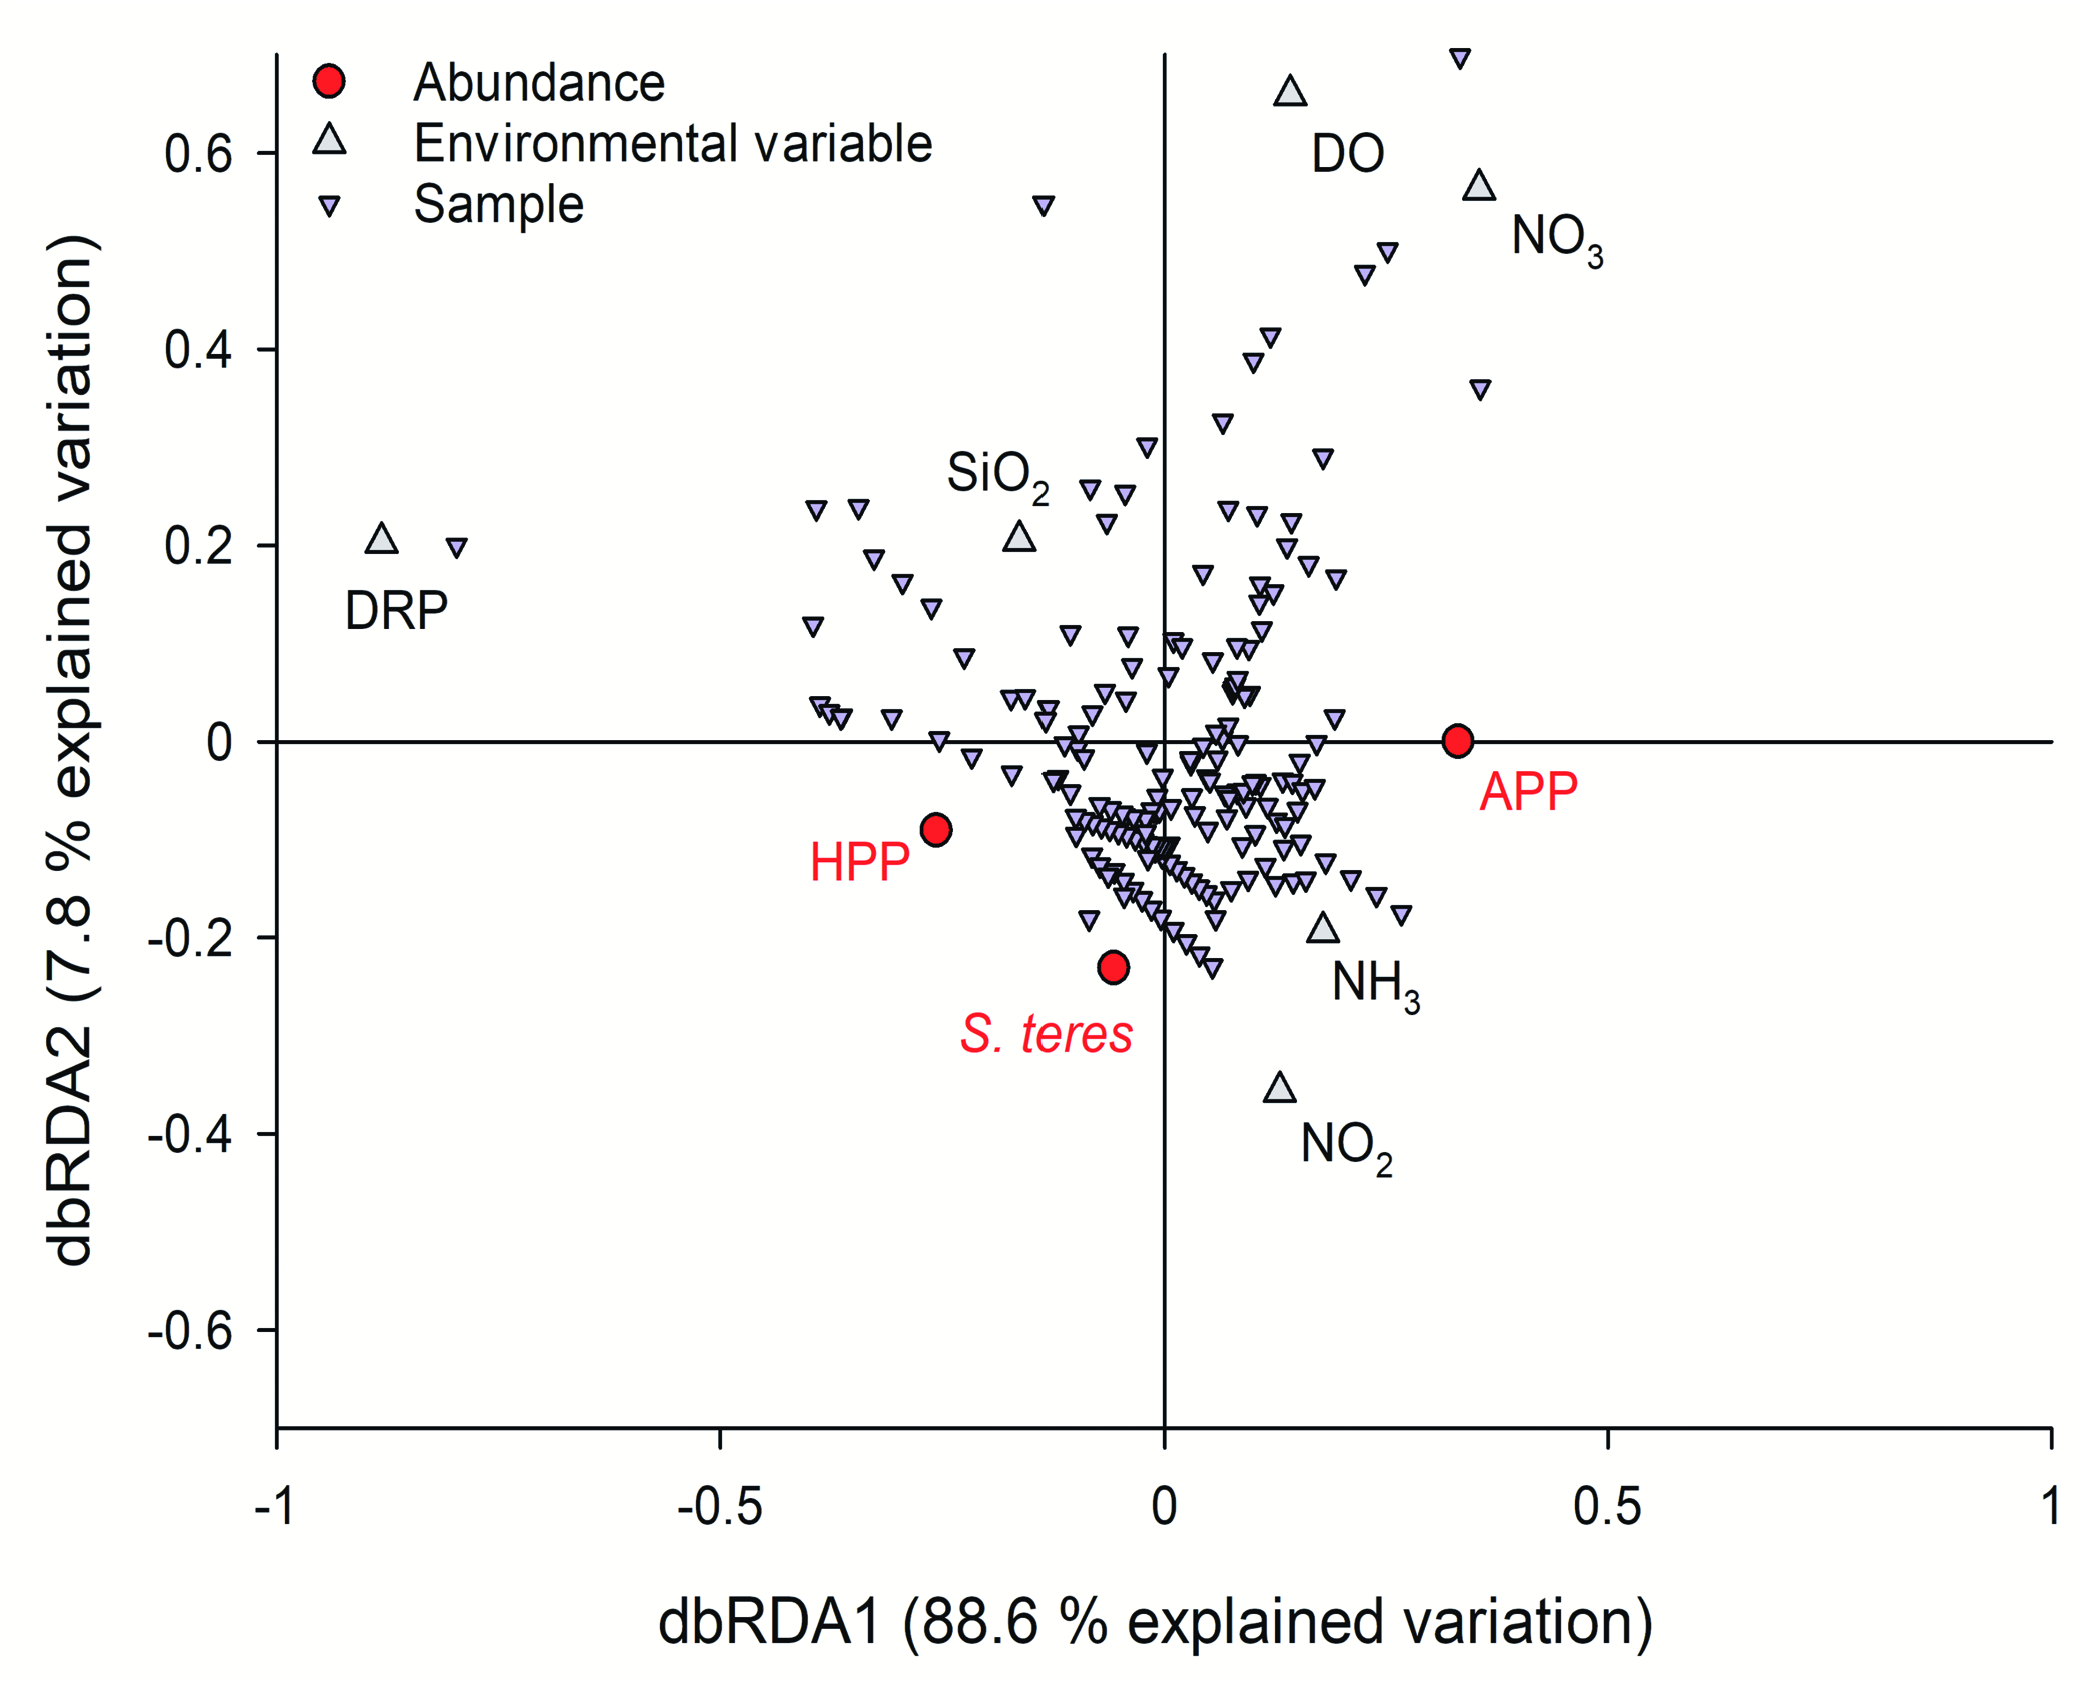
Table 1. Feeding experiments with S. teres (APP = autotrophic picoplankton [cells mL–1]: N = number of inspected ciliate cells; F = clearance rate [nL cell–1h–1]; G = grazing rate [cells cell–1h–1]; average was calculated as weighted by analysed ciliate cells in different layers).
| APP | N | F | SD | G | SD | ||||||||||
|---|---|---|---|---|---|---|---|---|---|---|---|---|---|---|---|
| lake | date | depth | cells mL- 1 | cells | 10 3 nL ciliate- 1 h-1 | APP ciliate- 1 h- 1 | |||||||||
| Alchichica | 25/10/2011 | 29 | 1.96×10 5 | 7 | 0.80 | 0.71 | 217 | 195 | |||||||
| Alchichica | 15/11/2011 | 30 | 2.20×10 5 | 7 | 0.41 | 0.18 | 135 | 60 | |||||||
| Alchichica | 11/09/2012 | 25 | 5.51×10 4 | 37 | 1.70 | 0.56 | 136 | 45 | |||||||
| 26 | 5.84×10 4 | 19 | 2.78 | 0.92 | 227 | 75 | |||||||||
| 27 | 3.21×10 4 | 34 | 2.28 | 0.68 | 122 | 36 | |||||||||
| 28 | 3.96×10 4 | 19 | 2.24 | 1.12 | 152 | 76 | |||||||||
| average | 109 | 2.16 | 0.76 | 150 | 53 | ||||||||||
| Alchichica | 24/10/2012 | 27 | 1.45×10 5 | 4 | 1.22 | 0.33 | 196 | 54 | |||||||
| 28 | 1.01×10 5 | 23 | 1.63 | 0.97 | 190 | 113 | |||||||||
| 29 | 9.29×10 4 | 15 | 1.87 | 0.89 | 198 | 95 | |||||||||
| 30 | 4.45×10 4 | 18 | 2.12 | 1.14 | 116 | 62 | |||||||||
| 31 | 3.93×10 4 | 13 | 2.21 | 0.98 | 111 | 49 | |||||||||
| 32 | 6033 | 3.52×10 4 | 2.93×10 4 | 23 | 29 | 1.97 | 2.14 | 1.25 | 1.25 | 96 | 93 | 6033 | 54 | ||
| 6033 | 2.93×10 4 | 29 | 2.14 | 1.25 | 93 | 6033 | 54 | ||||||||
| average | 125 | 1.96 | 1.08 | 132 | 72 | ||||||||||
| La Preciosa | 26/10/2011 | 26 | 4.36×10 5 | 21 | 1.18 | 0.82 | 595 | 414 | |||||||
| 27 | 1.53×10 5 | 14 | 1.50 | 1.46 | 334 | 327 | |||||||||
| 28 | 8.44×10 4 | 1 | 2.84 | 384 | |||||||||||
| average | 36 | 1.35 | 1045 | 488 | 369 | ||||||||||
| La Preciosa | 12/09/2012 | 19 | 2.06×10 5 | 96 | 1.40 | 0.65 | 307 | 141 | |||||||
| 20 | 1.40×10 5 | 72 | 2.13 | 1.03 | 326 | 158 | |||||||||
| 21 | 1.23×10 5 | 50 | 3.65 | 0.94 | 490 | 127 | |||||||||
| 22 | 6.09×10 4 | 20 | 2.19 | 0.75 | 162 | 56 | |||||||||
| 23 | 2.47×10 4 | 4 | 1.74 | 1.72 | 60 | 60 | |||||||||
| average | 242 | 2.15 | 0.85 | 334 | 135 | ||||||||||
| La Preciosa | 25/10/2012 | 23 | 1.24×10 5 | 3 | 1.24 | 0.51 | 192 | 79 | |||||||
| 24 | 2.09×10 4 | 17 | 1.11 | 0.30 | 57 | 15 | |||||||||
| 25 | 4.61×10 4 | 1 | 0.48 | 43 | |||||||||||
| average | 21 | 1.09 | 0.31 | 76 | 24 | ||||||||||
| La Cruz | 25/06/2010 | experiment | 3.50×10 5 | 40 | 0.275 | 0.065 | 115 | 27 | |||||||
| APP |
Parco Nazionale del Gran Sasso e Monti della Laga - Università di Camerino |
No known copyright restrictions apply. See Agosti, D., Egloff, W., 2009. Taxonomic information exchange and copyright: the Plazi approach. BMC Research Notes 2009, 2:53 for further explanation.